
Liver fibrosis and inflammation,quantified across the whole section
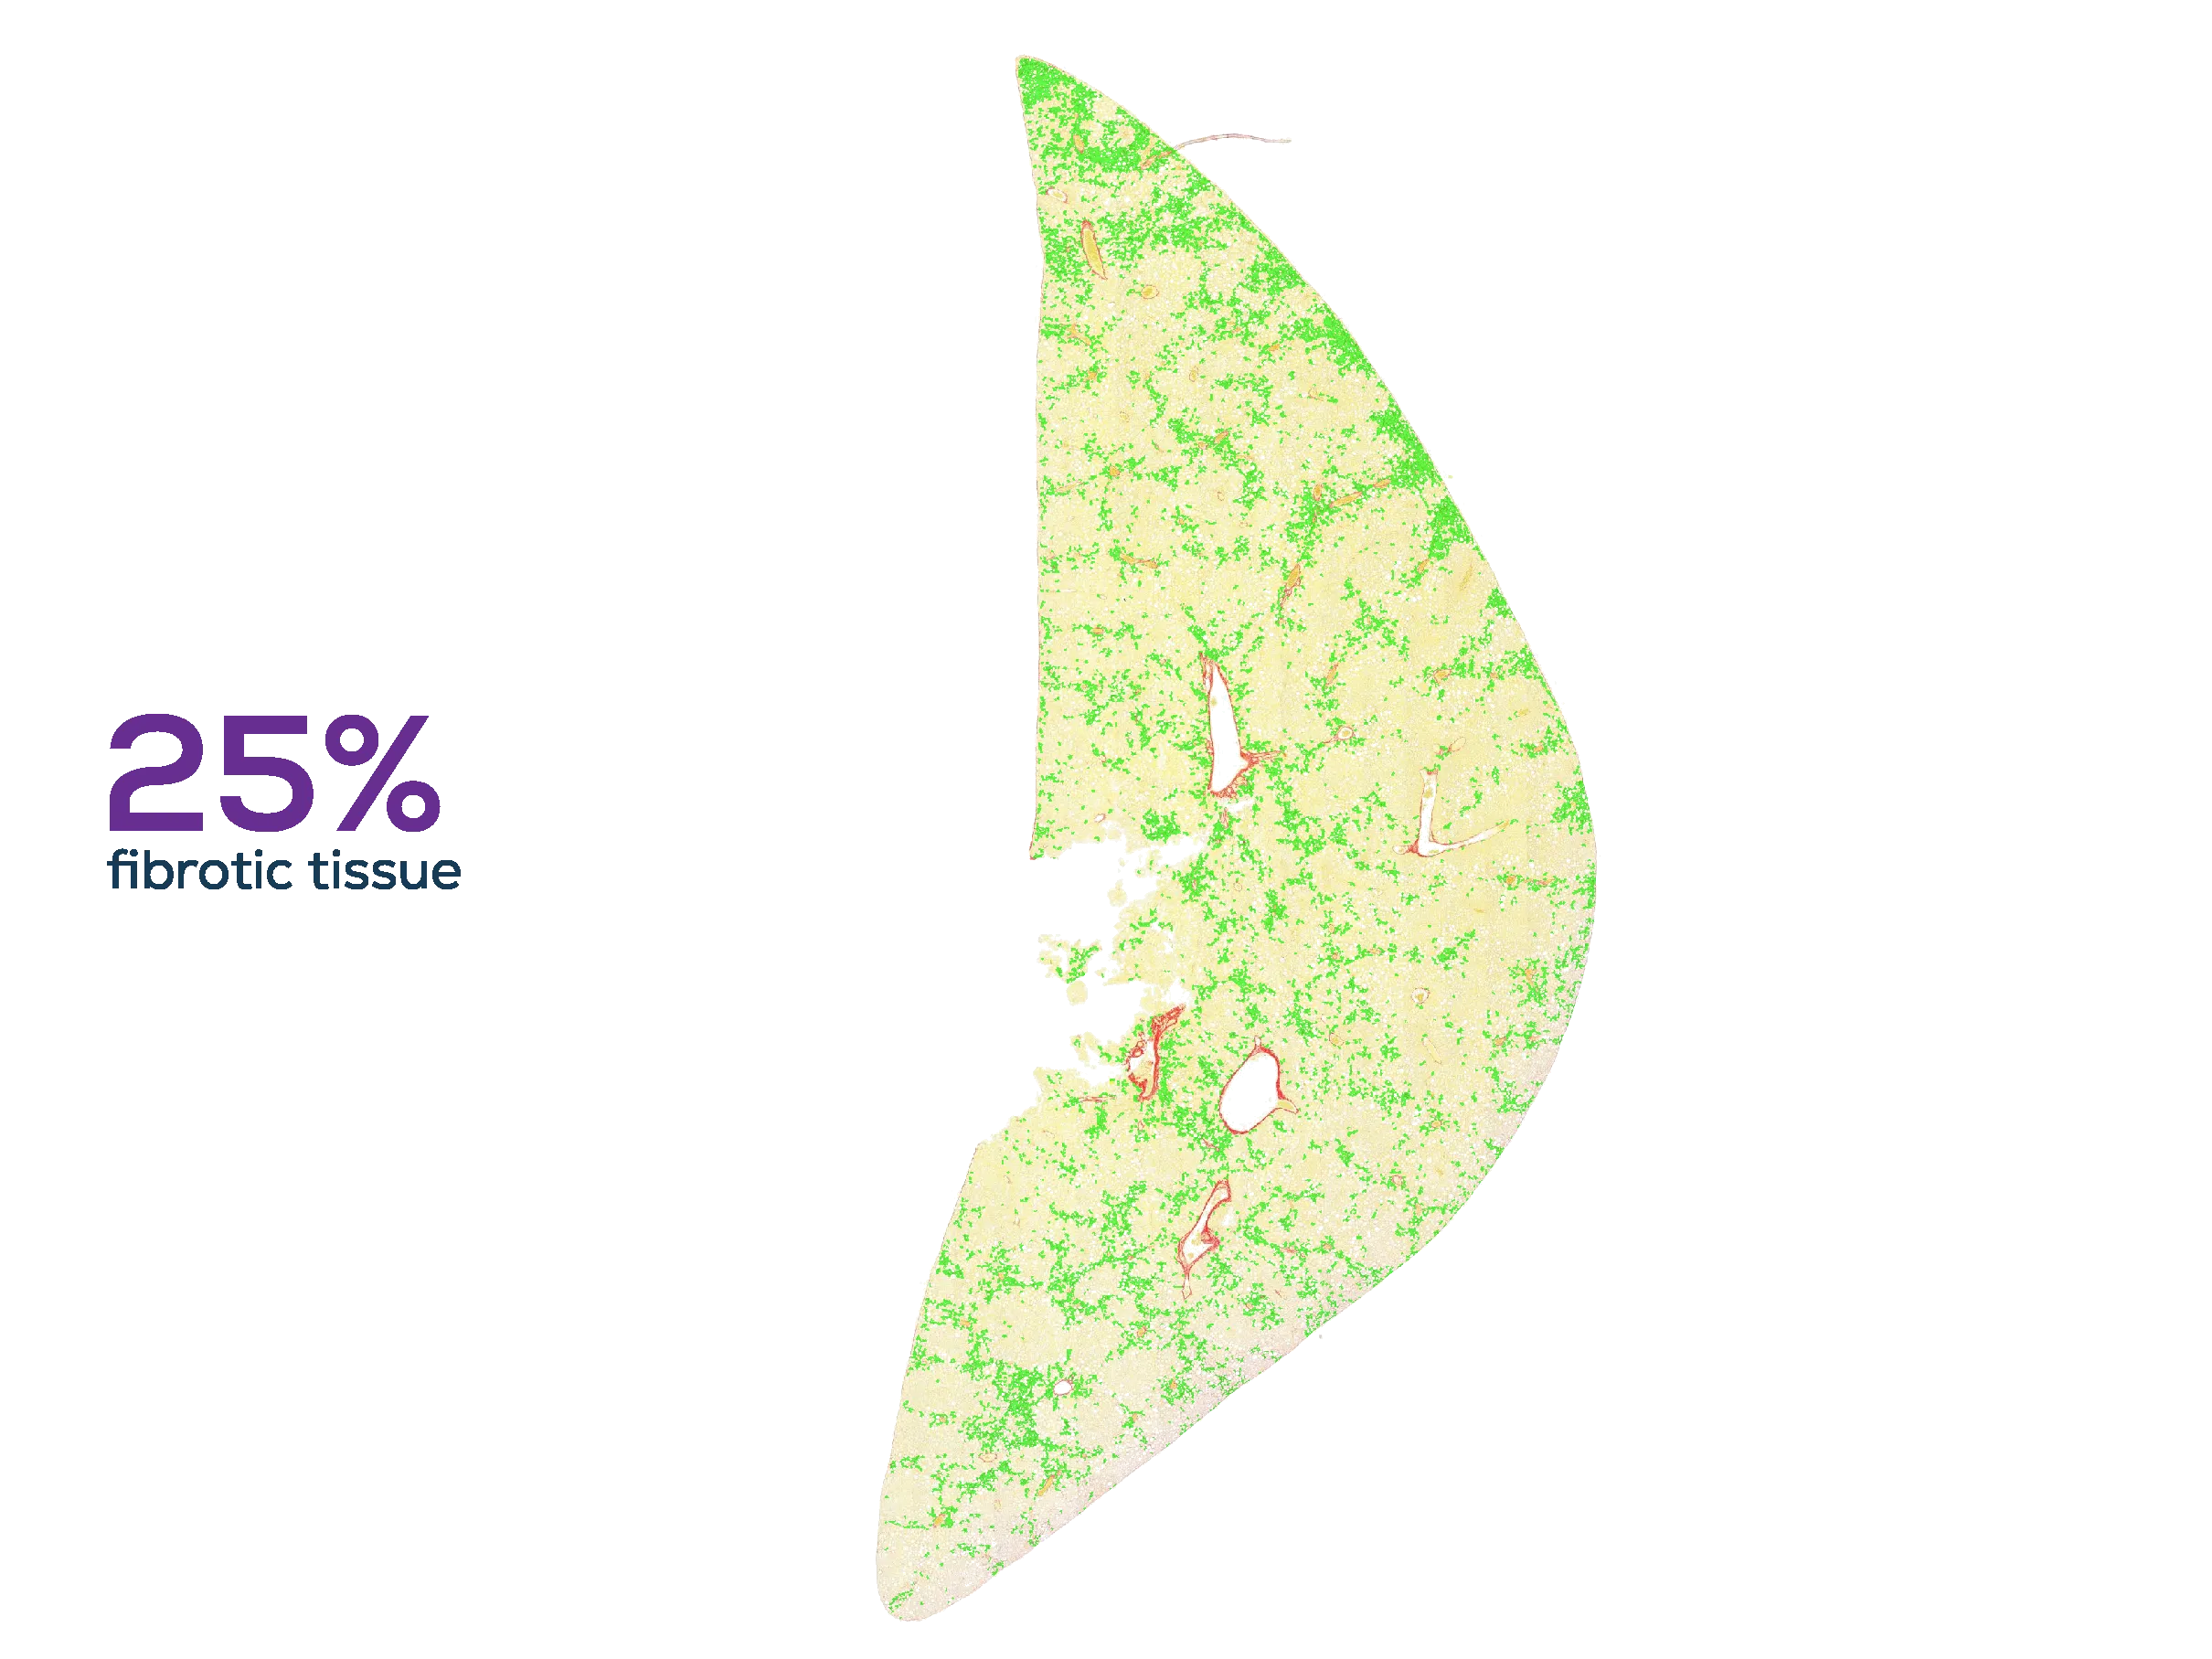
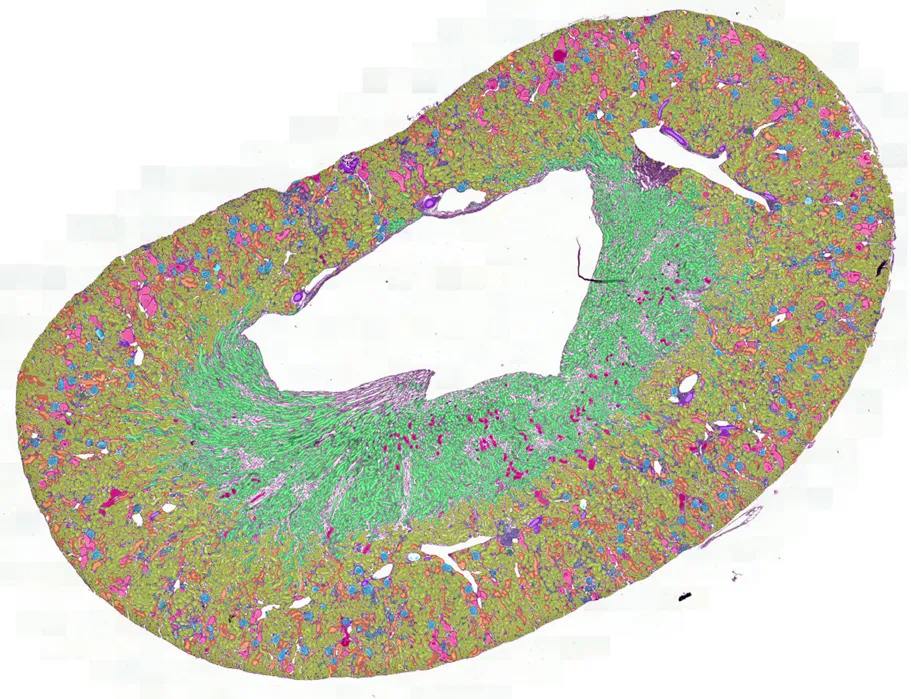
In preclinical MASH studies, Aiosyn's AI quantifies fibrosis and lobular inflammation across the full liver section of every animal in your cohort. Read-outs are returned per animal and per experimental group, produced by one fixed method on every slide.
- Full section quantified, no sampled fields
- Same section, same read-out, every run
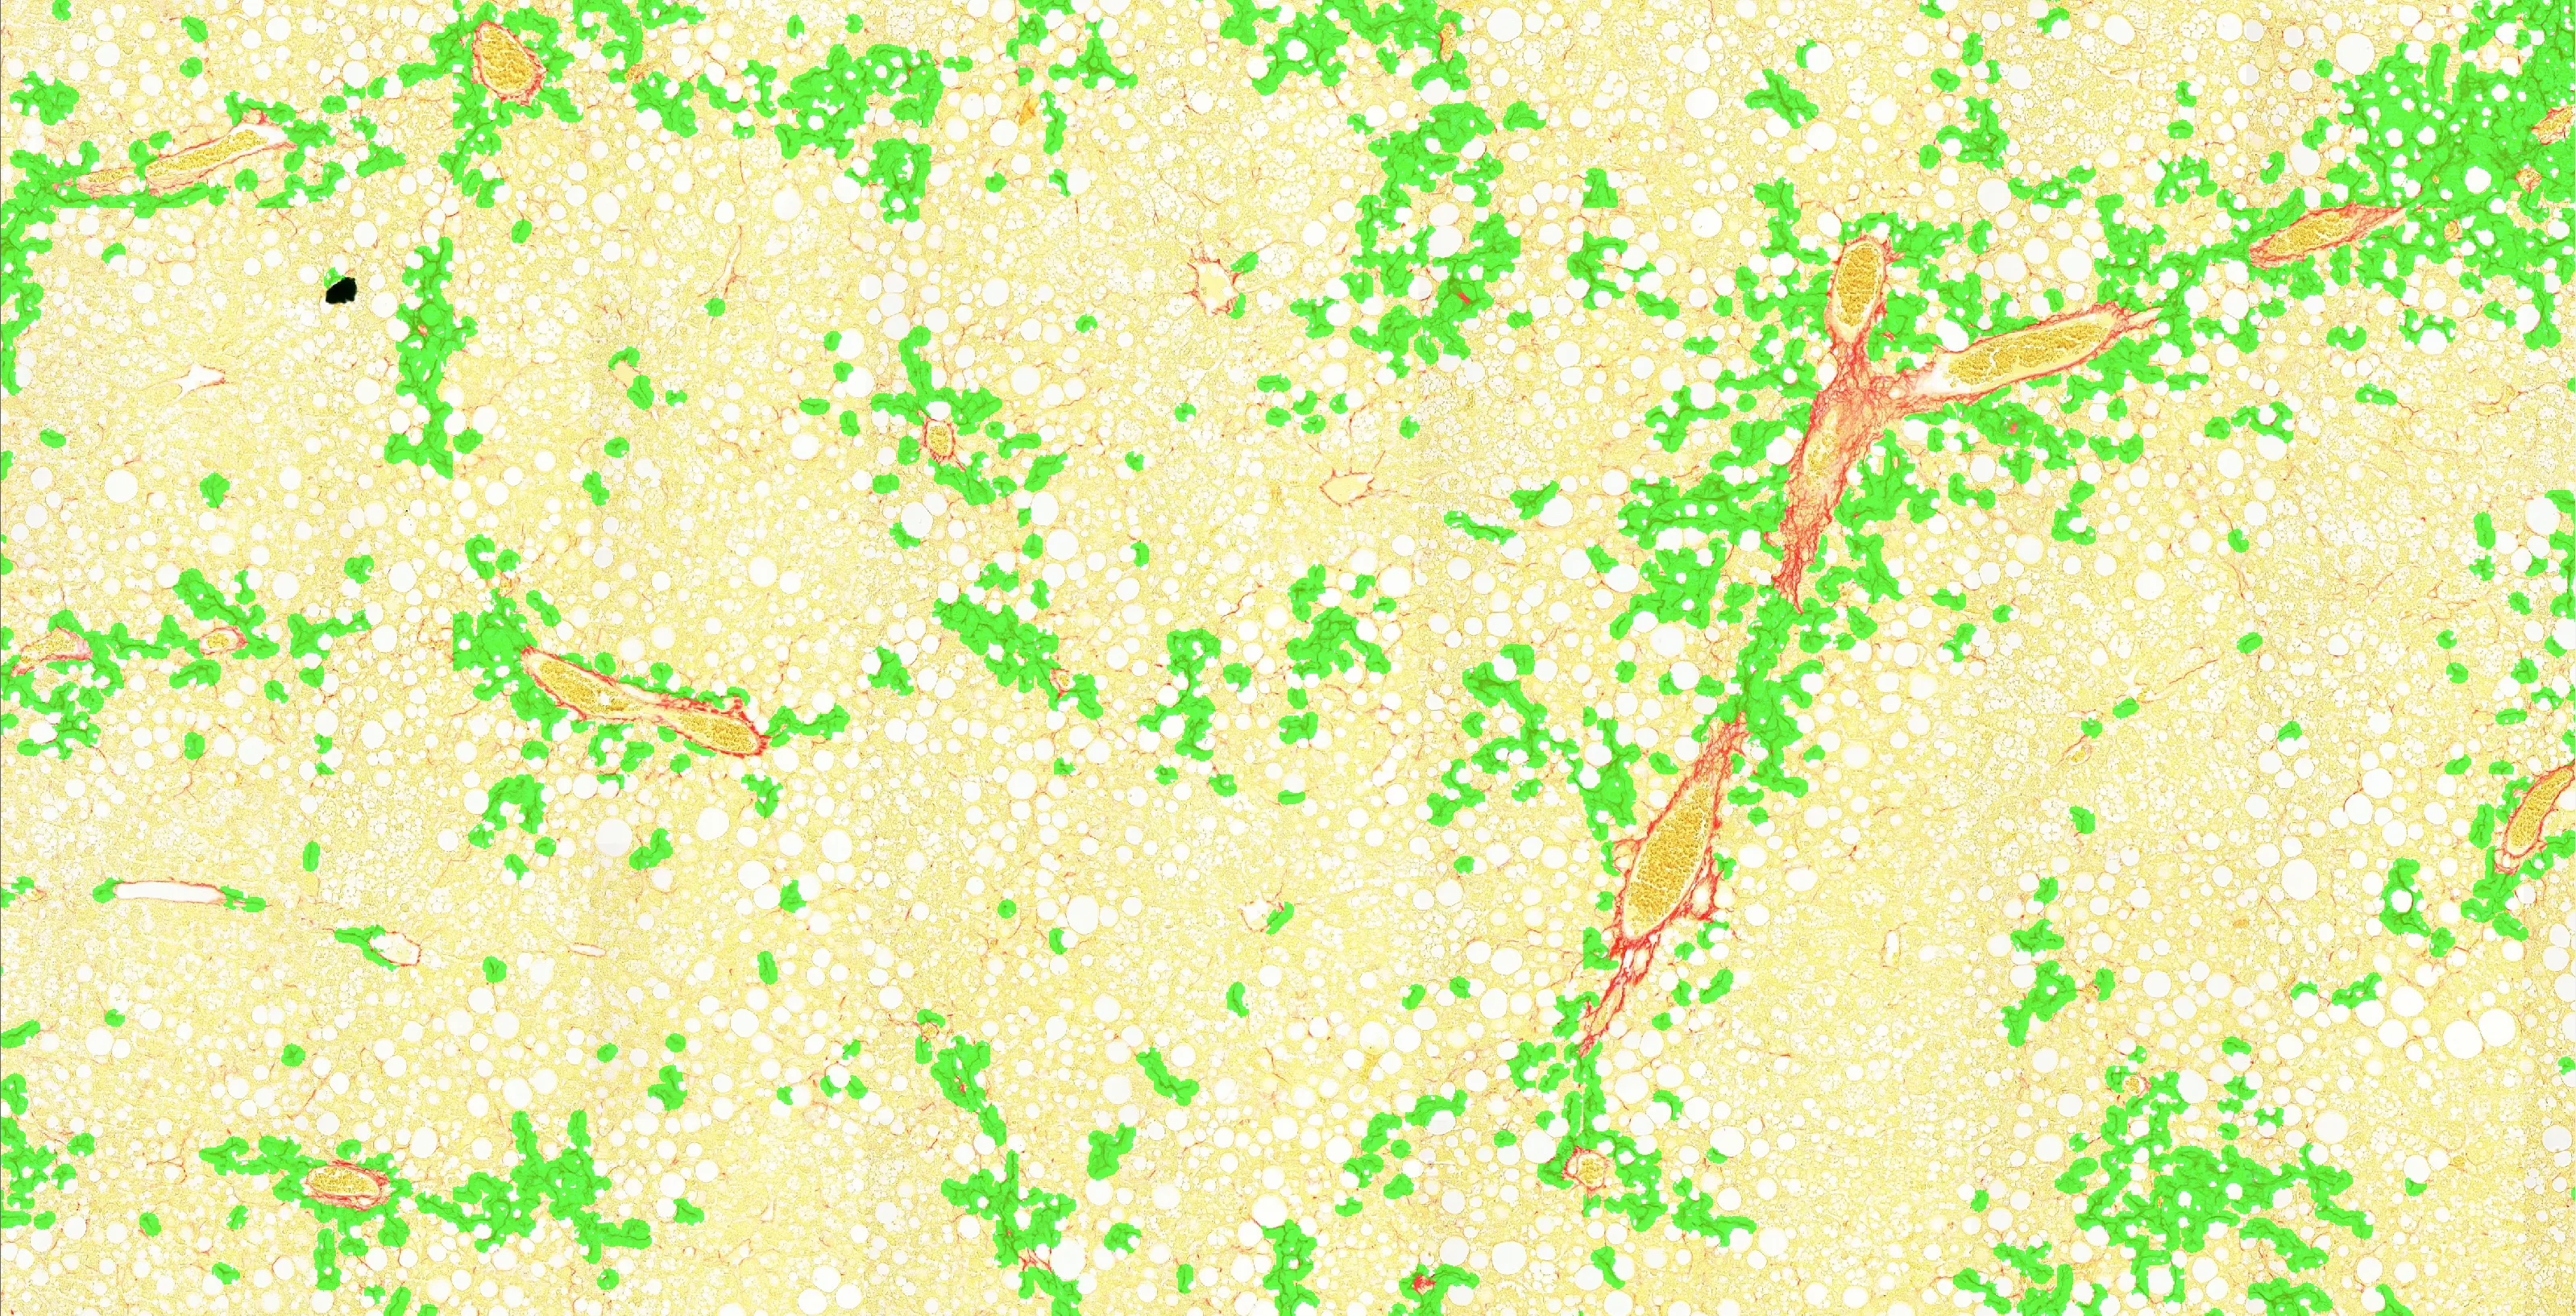
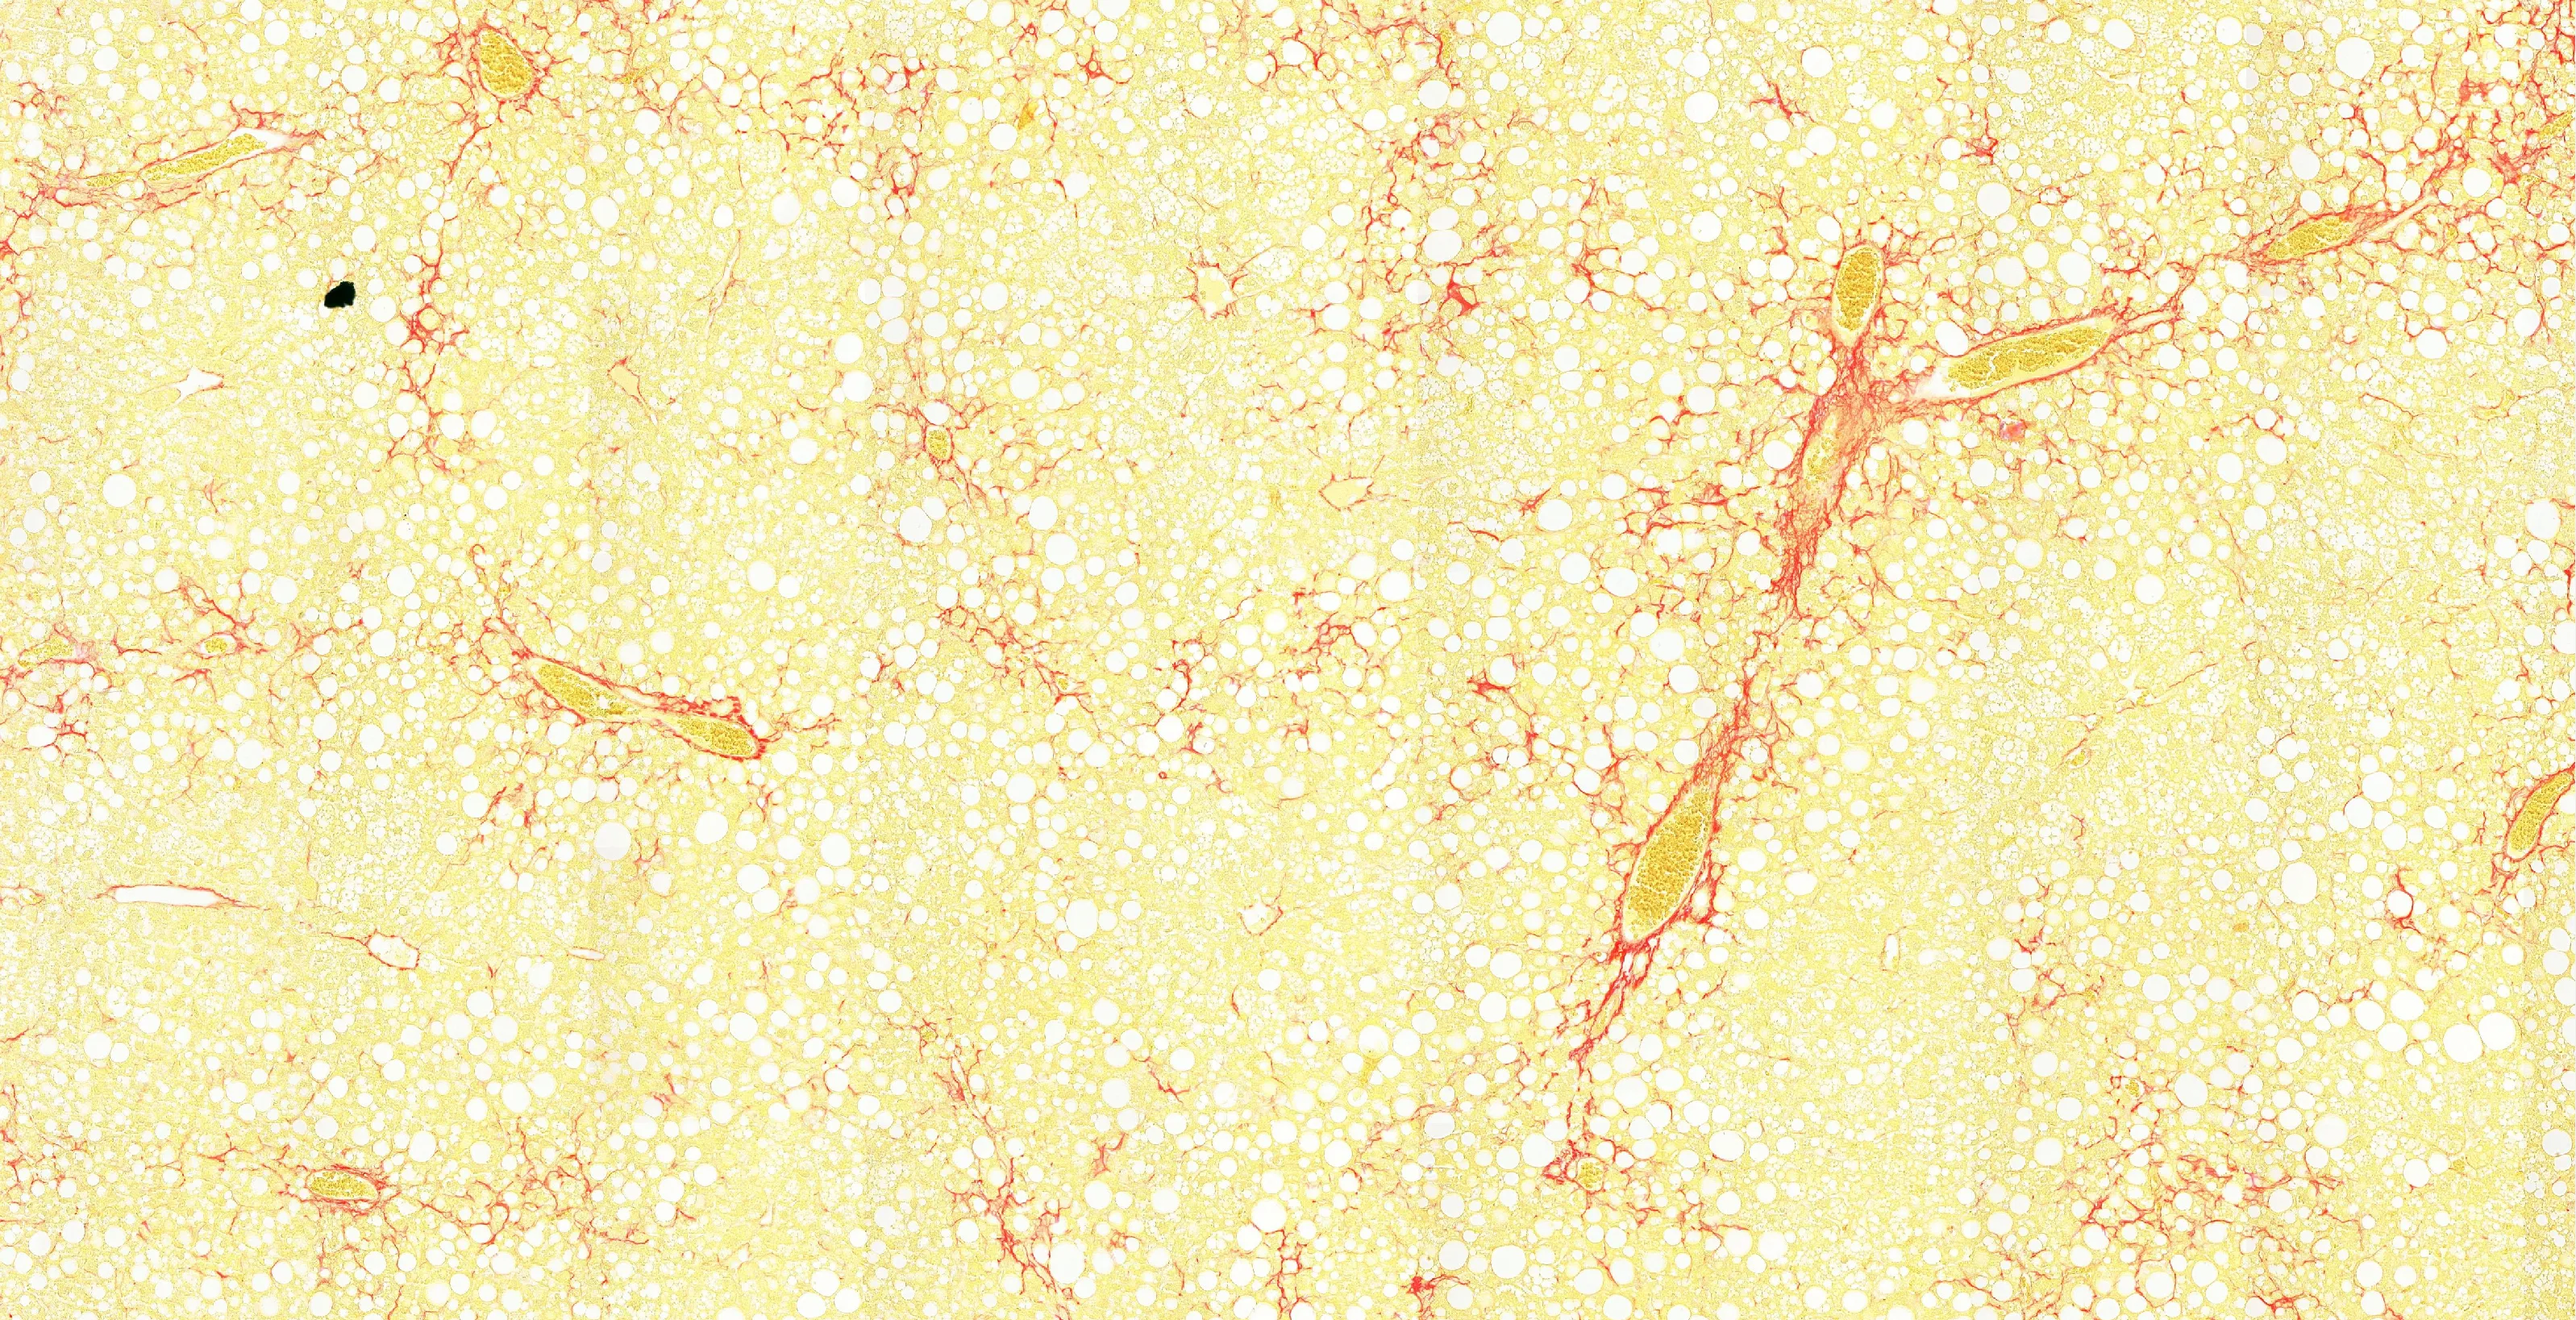 Stained sectionAI read-out
- Fibrotic tissue
Fibrosis read-outs tracked expert pathologist scoring
Together with TNO, we validated our fibrosis read-out on mouse liver sections spanning treated and untreated groups. An expert pathologist scored the percentage of each section covered by fibrosis, and the AI measured it independently on the same sections.
AI against expert pathologist
Fibrotic tissue, whole liver section
- Correlation
- r = 0.95
- Variance explained
- R² = 0.91
- Sections
- 76
Each point is one section: the pathologist's score on the horizontal axis, the AI's on the vertical, against the line of perfect agreement.
Inflammation, detected on the same section
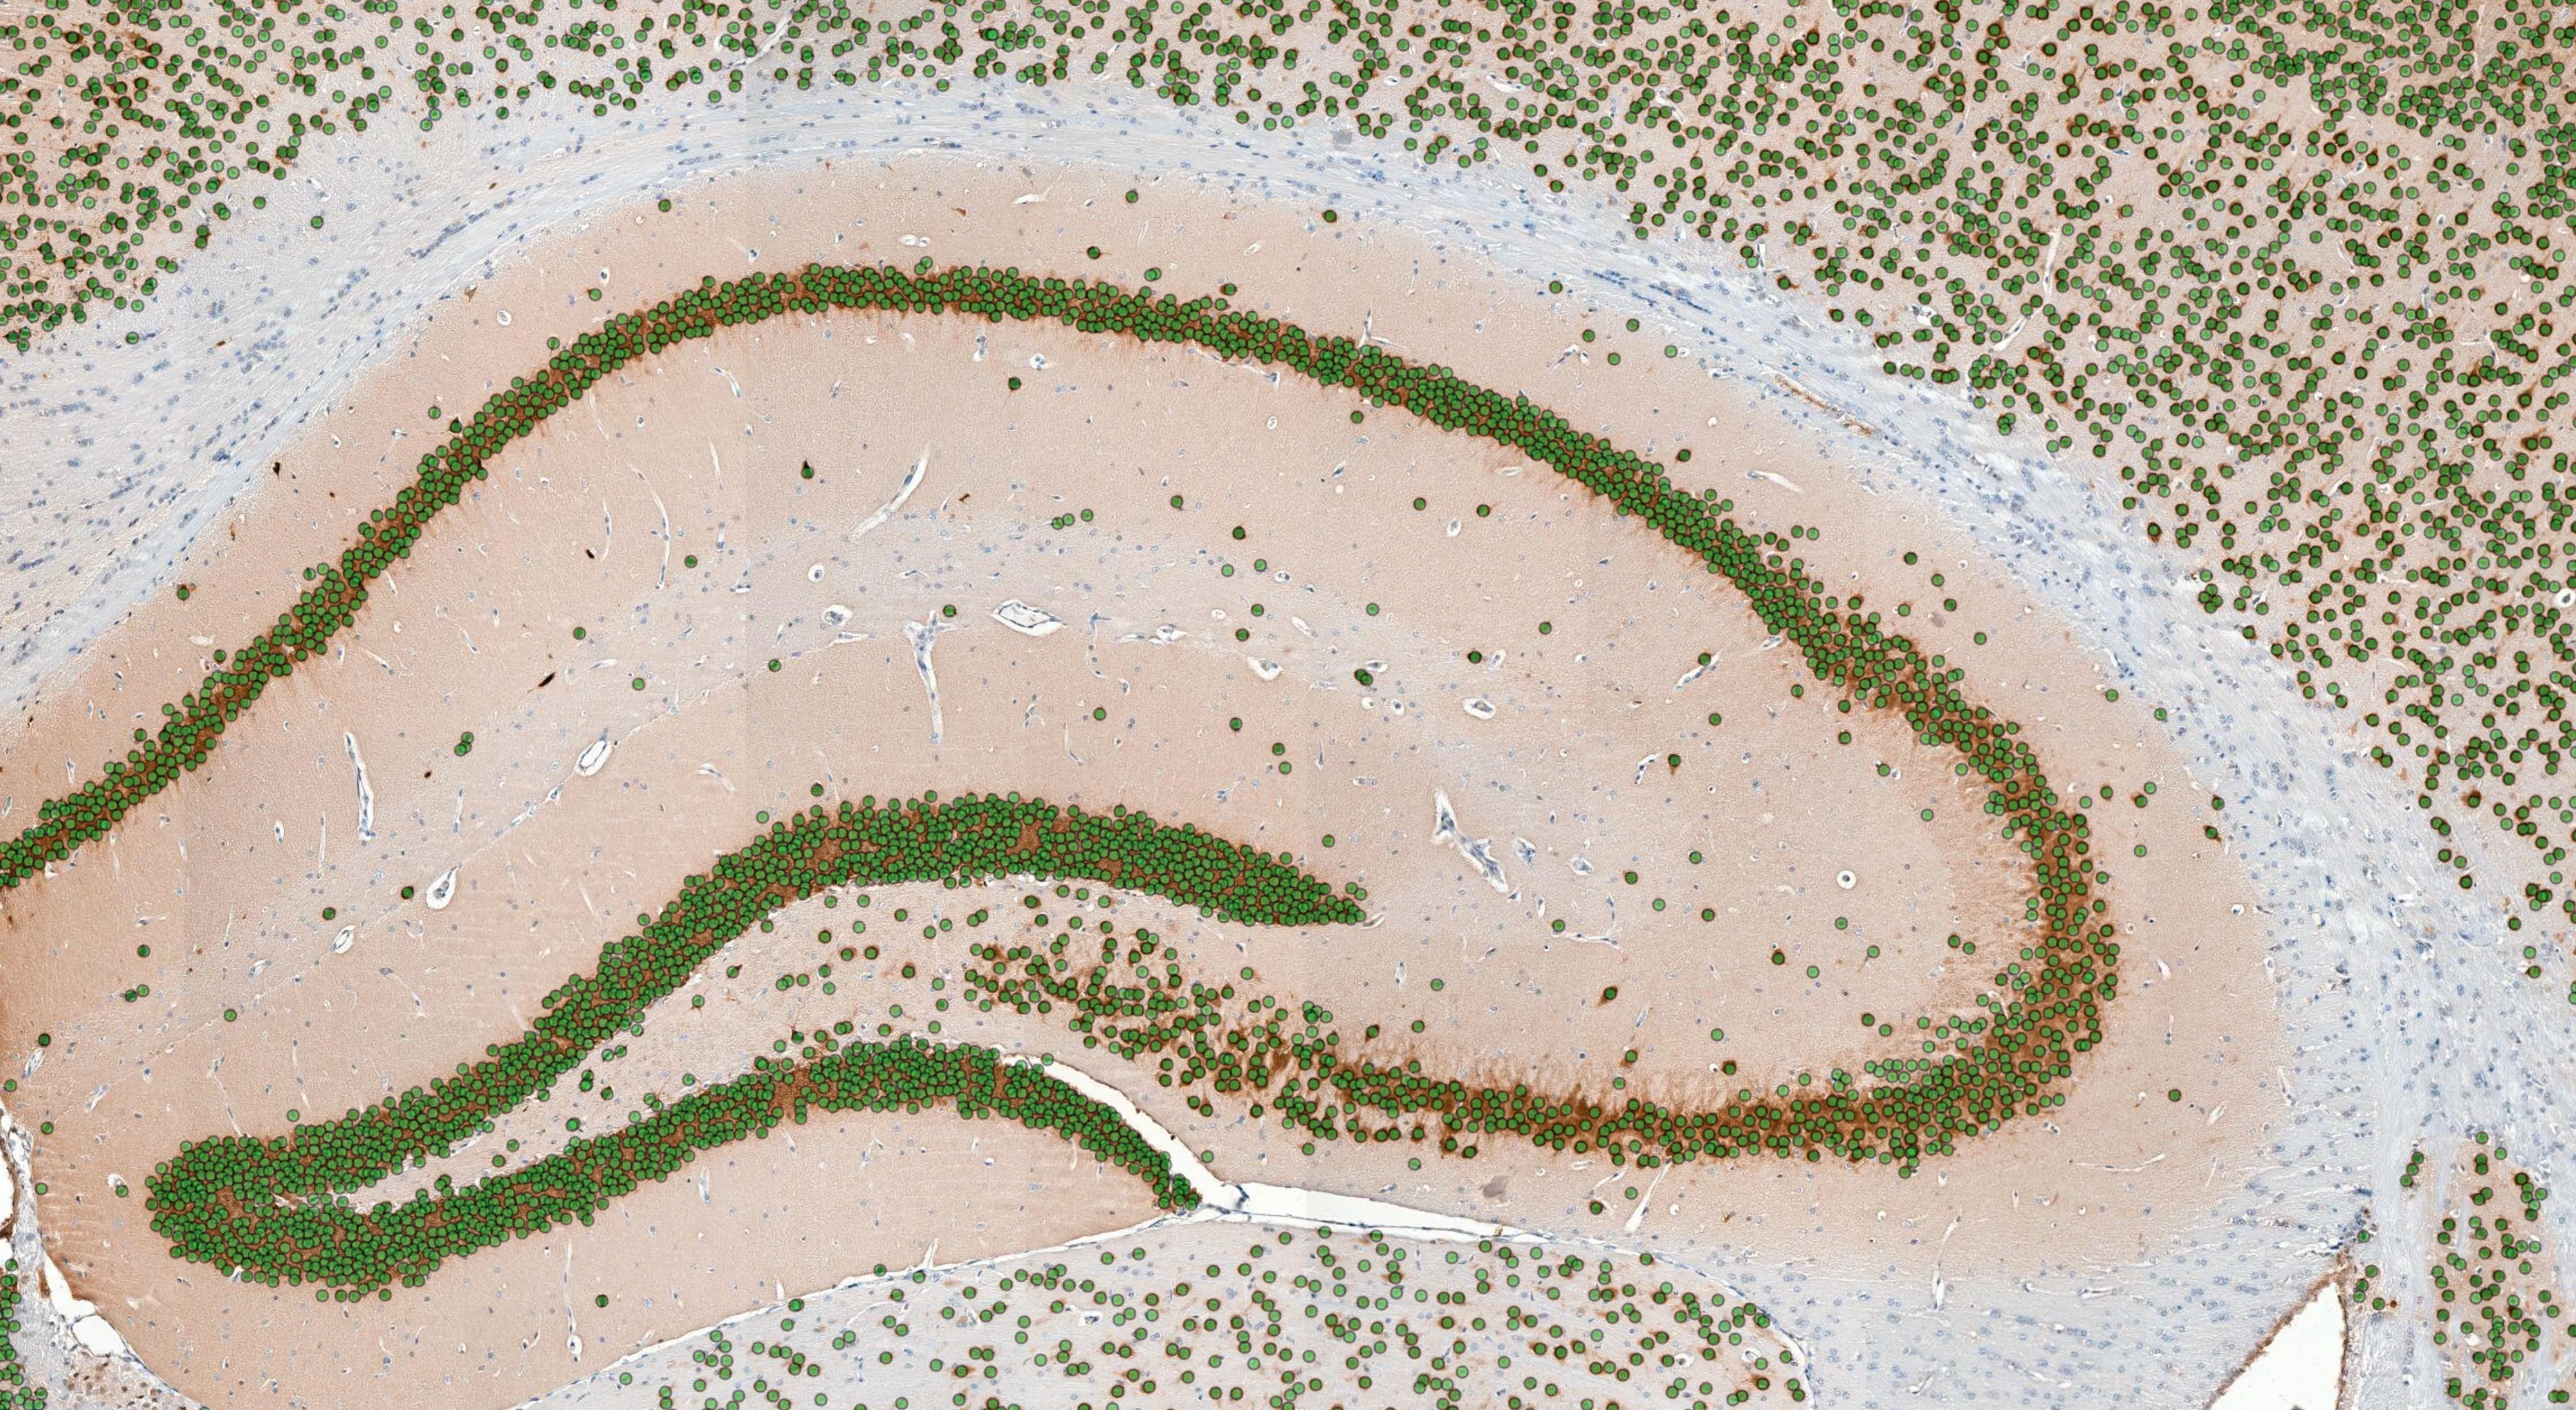
Inflammatory-cell aggregates are detected across the full liver section and returned as a density per mm², on the same tissue that gave the fibrosis read-out. The individual cells inside each aggregate are counted on the same pass, so cells per aggregate and total counts come back with it.
From liver section to MASH read-outs
- 1
Share your sections
Whole-slide images of the liver sections in the formats you already scan. No change to how they are cut, stained or digitized.
- 2
Every section is read
Fibrosis is segmented, inflammatory cells are detected, and macrovesicular and microvesicular steatosis are quantified as affected tissue, on every slide in the cohort under one fixed method.
- 3
Read-outs come back quantified
Per-animal and per-group numbers, with the segmentations and detections behind them.
A liver read-out this page does not cover
Another stain, another species or an endpoint specific to your model is built on your own images as custom AI development.
Co-developed with TNO Health & Work
Through our partnership, we co-develop these models together with TNO. Their preclinical and pharmaceutical research expertise sits behind the study design and the tissue, our AI behind the read-outs, and the models are applied within TNO's preclinical studies with more study areas in development.
Continue with another tissue
Biopharma overview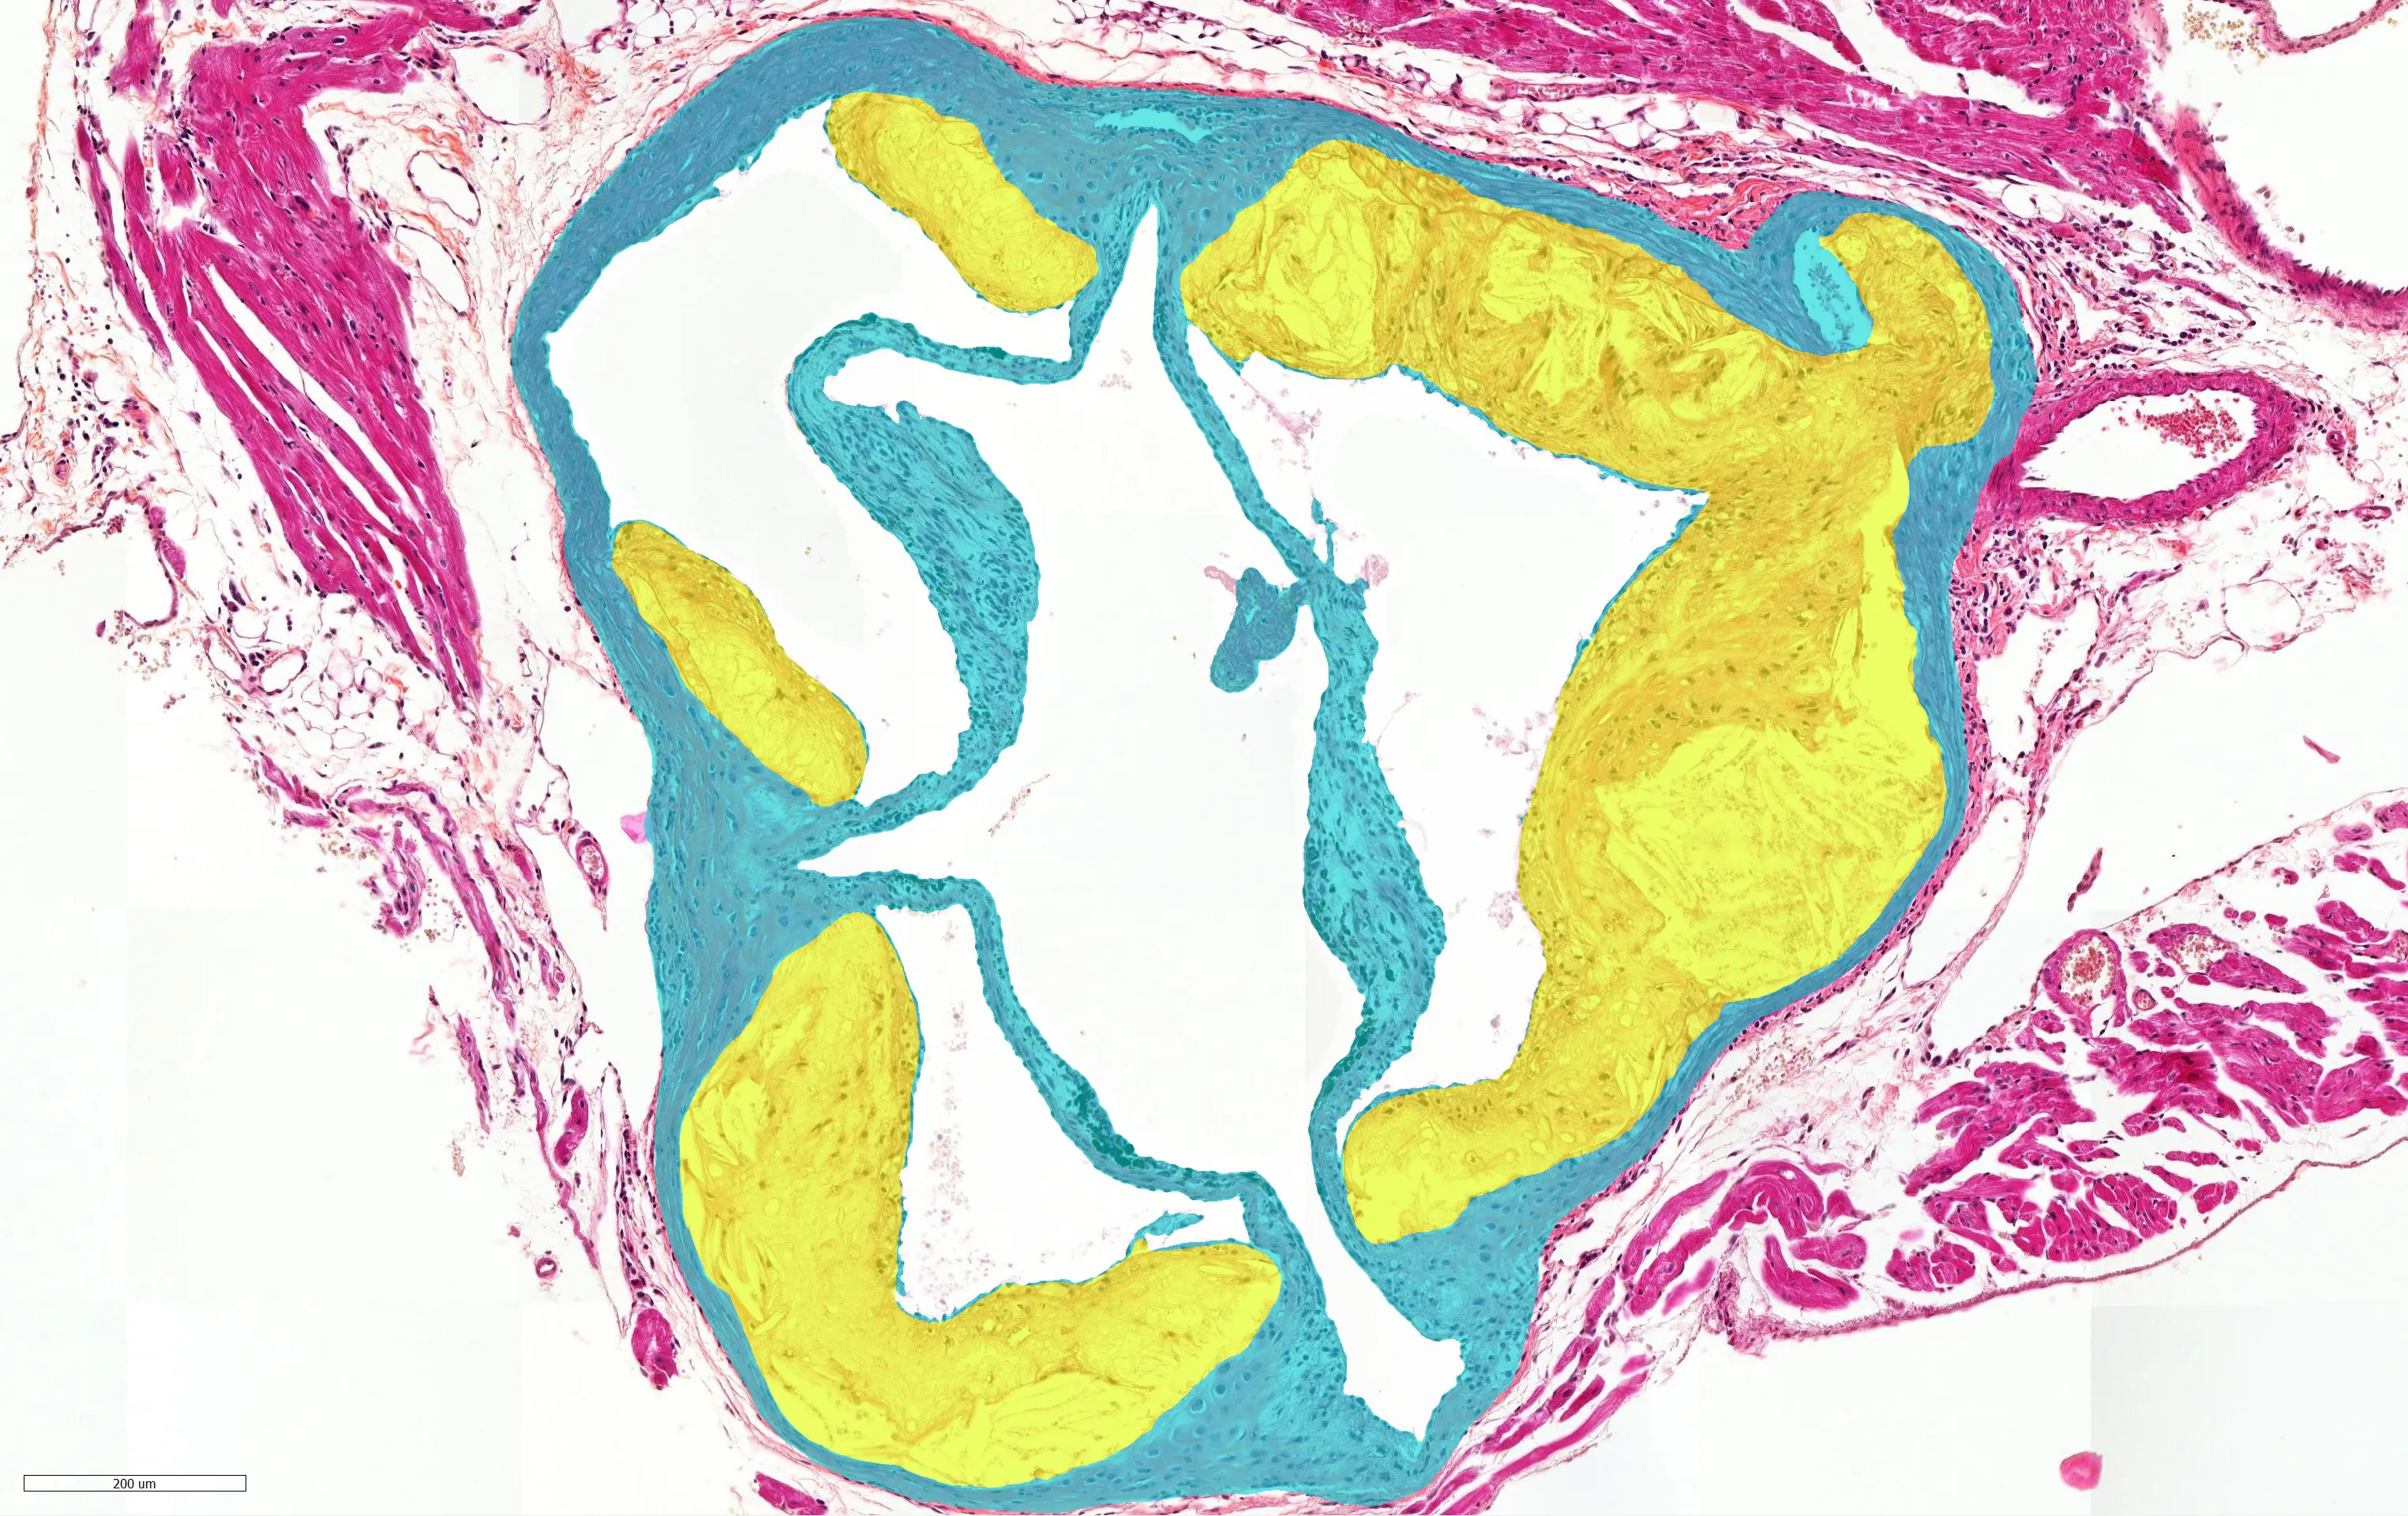
Send us a few liver sections
We return the fibrosis and inflammation read-outs on your own tissue, next to the scoring your study runs today.
Message sent
Thank you. We will get back to you.