
Neuron loss and neuroinflammation,measured per brain region
Two questions that recur across most brain studies, answered as numbers per region instead of a semiquantitative score. Aiosyn's AI delineates the anatomical regions on each stained section, then detects individual NeuN-positive neurons or Iba1-positive microglia within them, across the whole section under one fixed method.
- Continuous numbers, no semiquantitative score
- Whole section measured, no sampled fields
- Same section, same density, every run
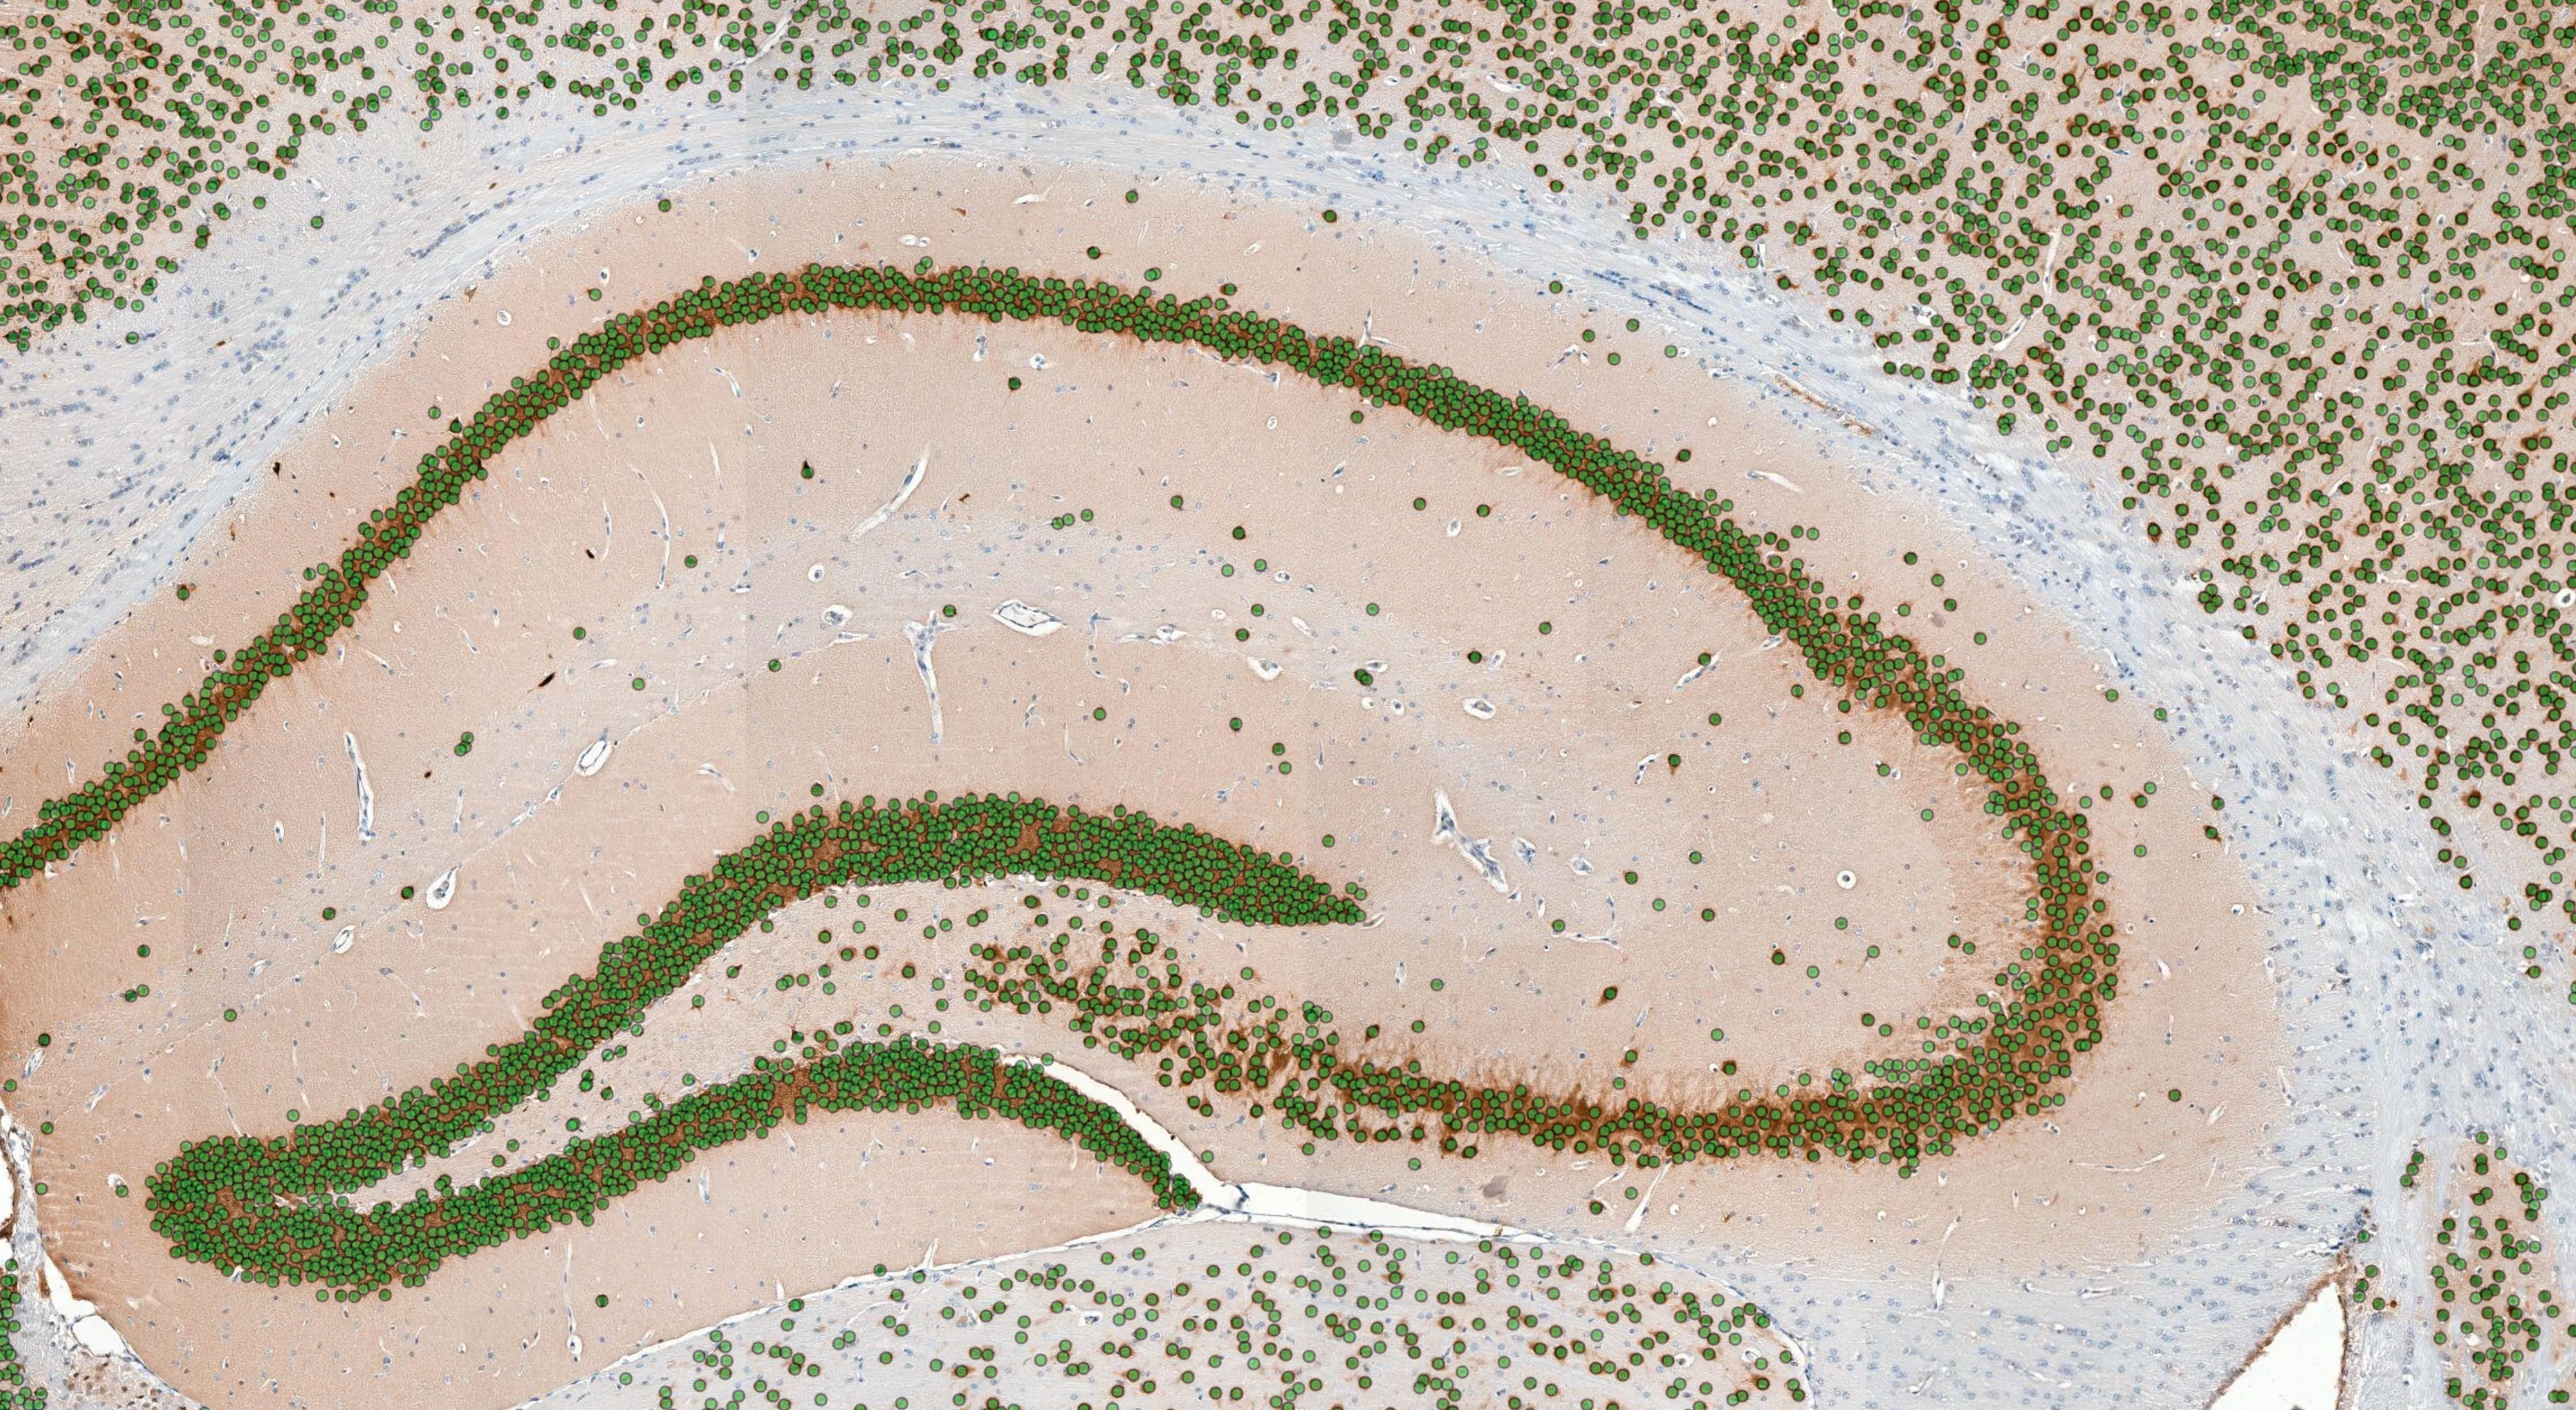
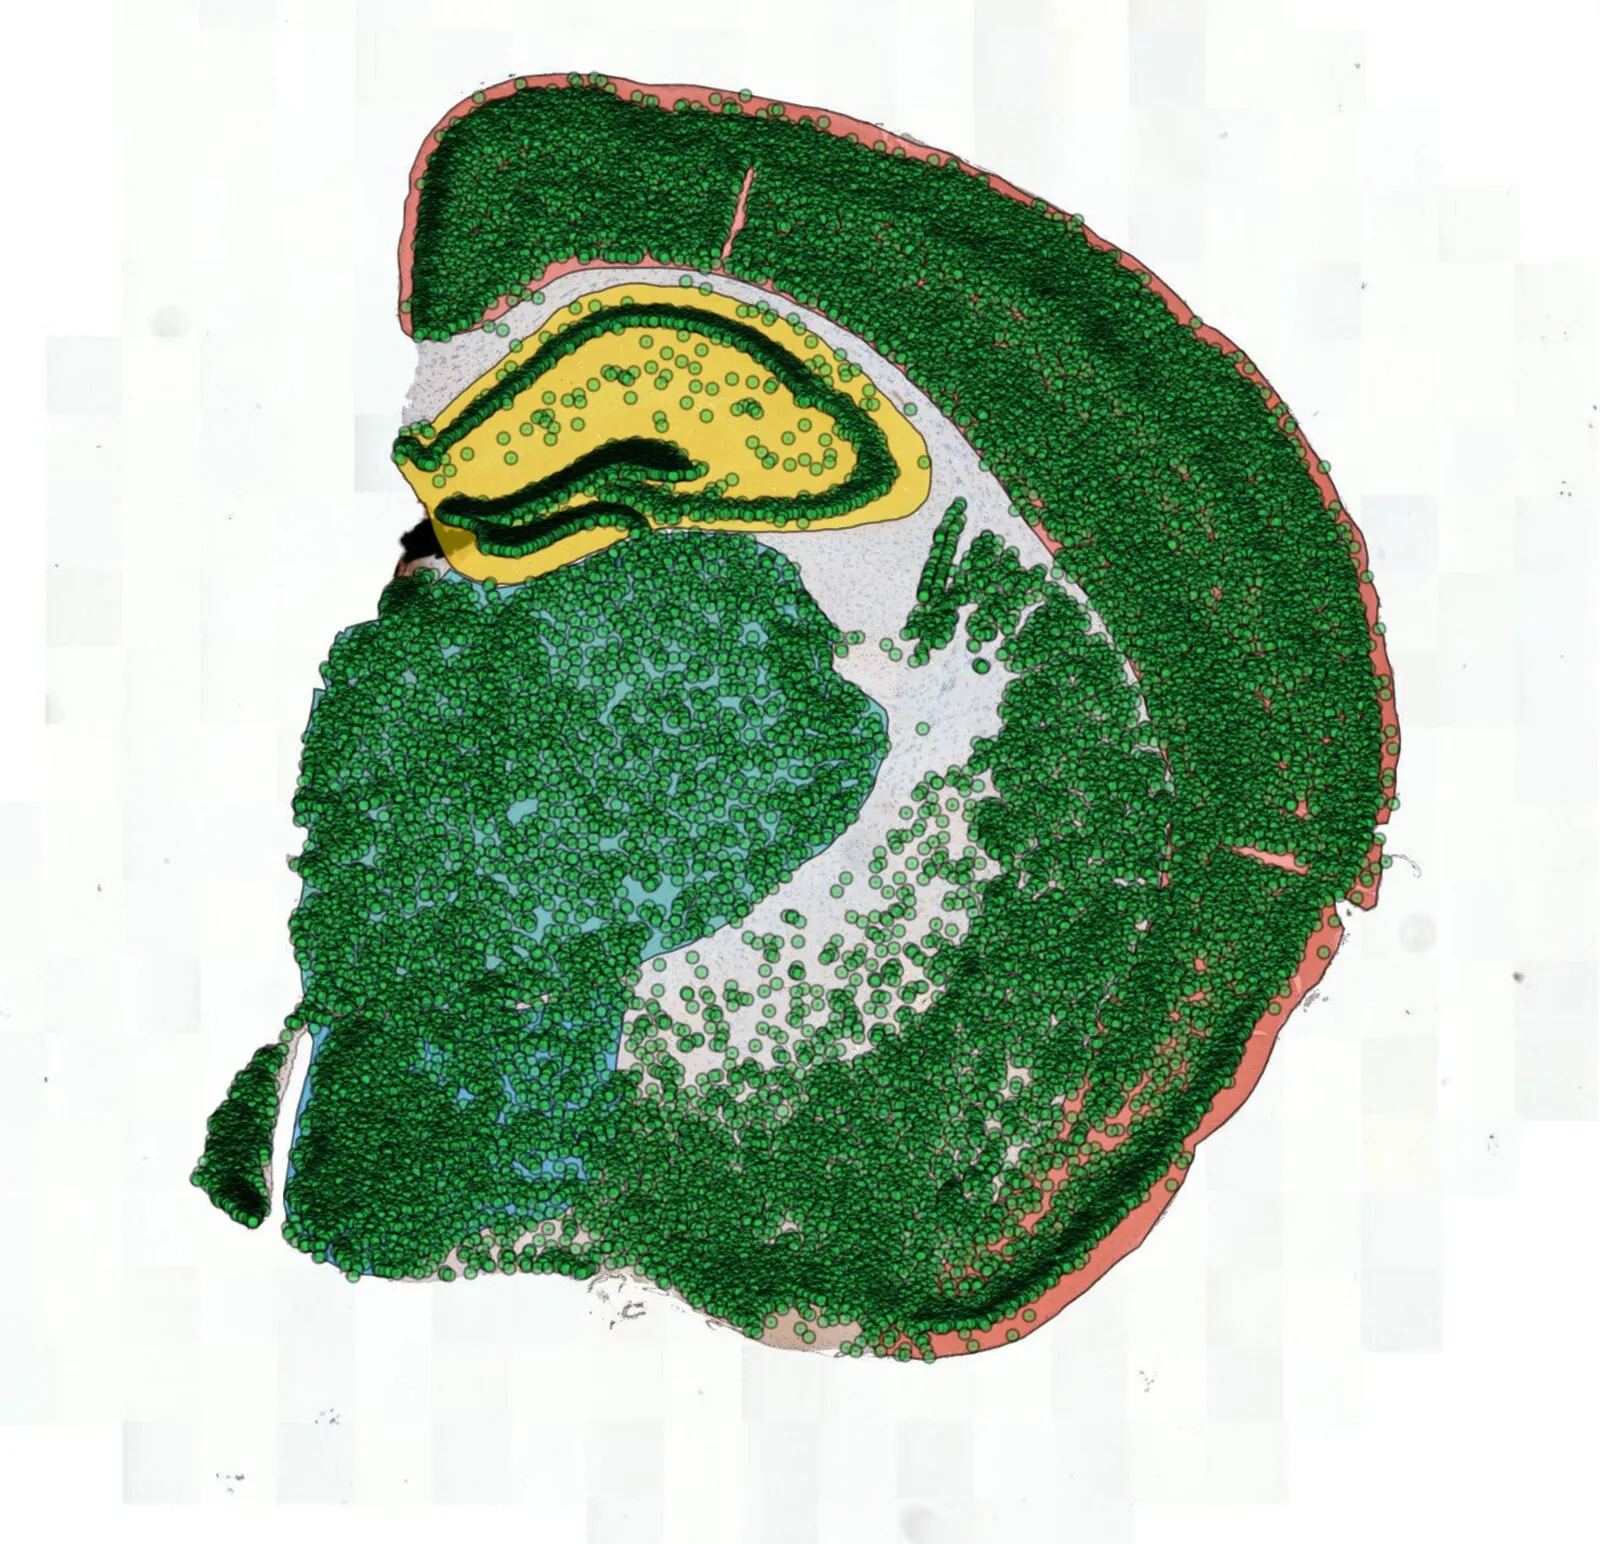
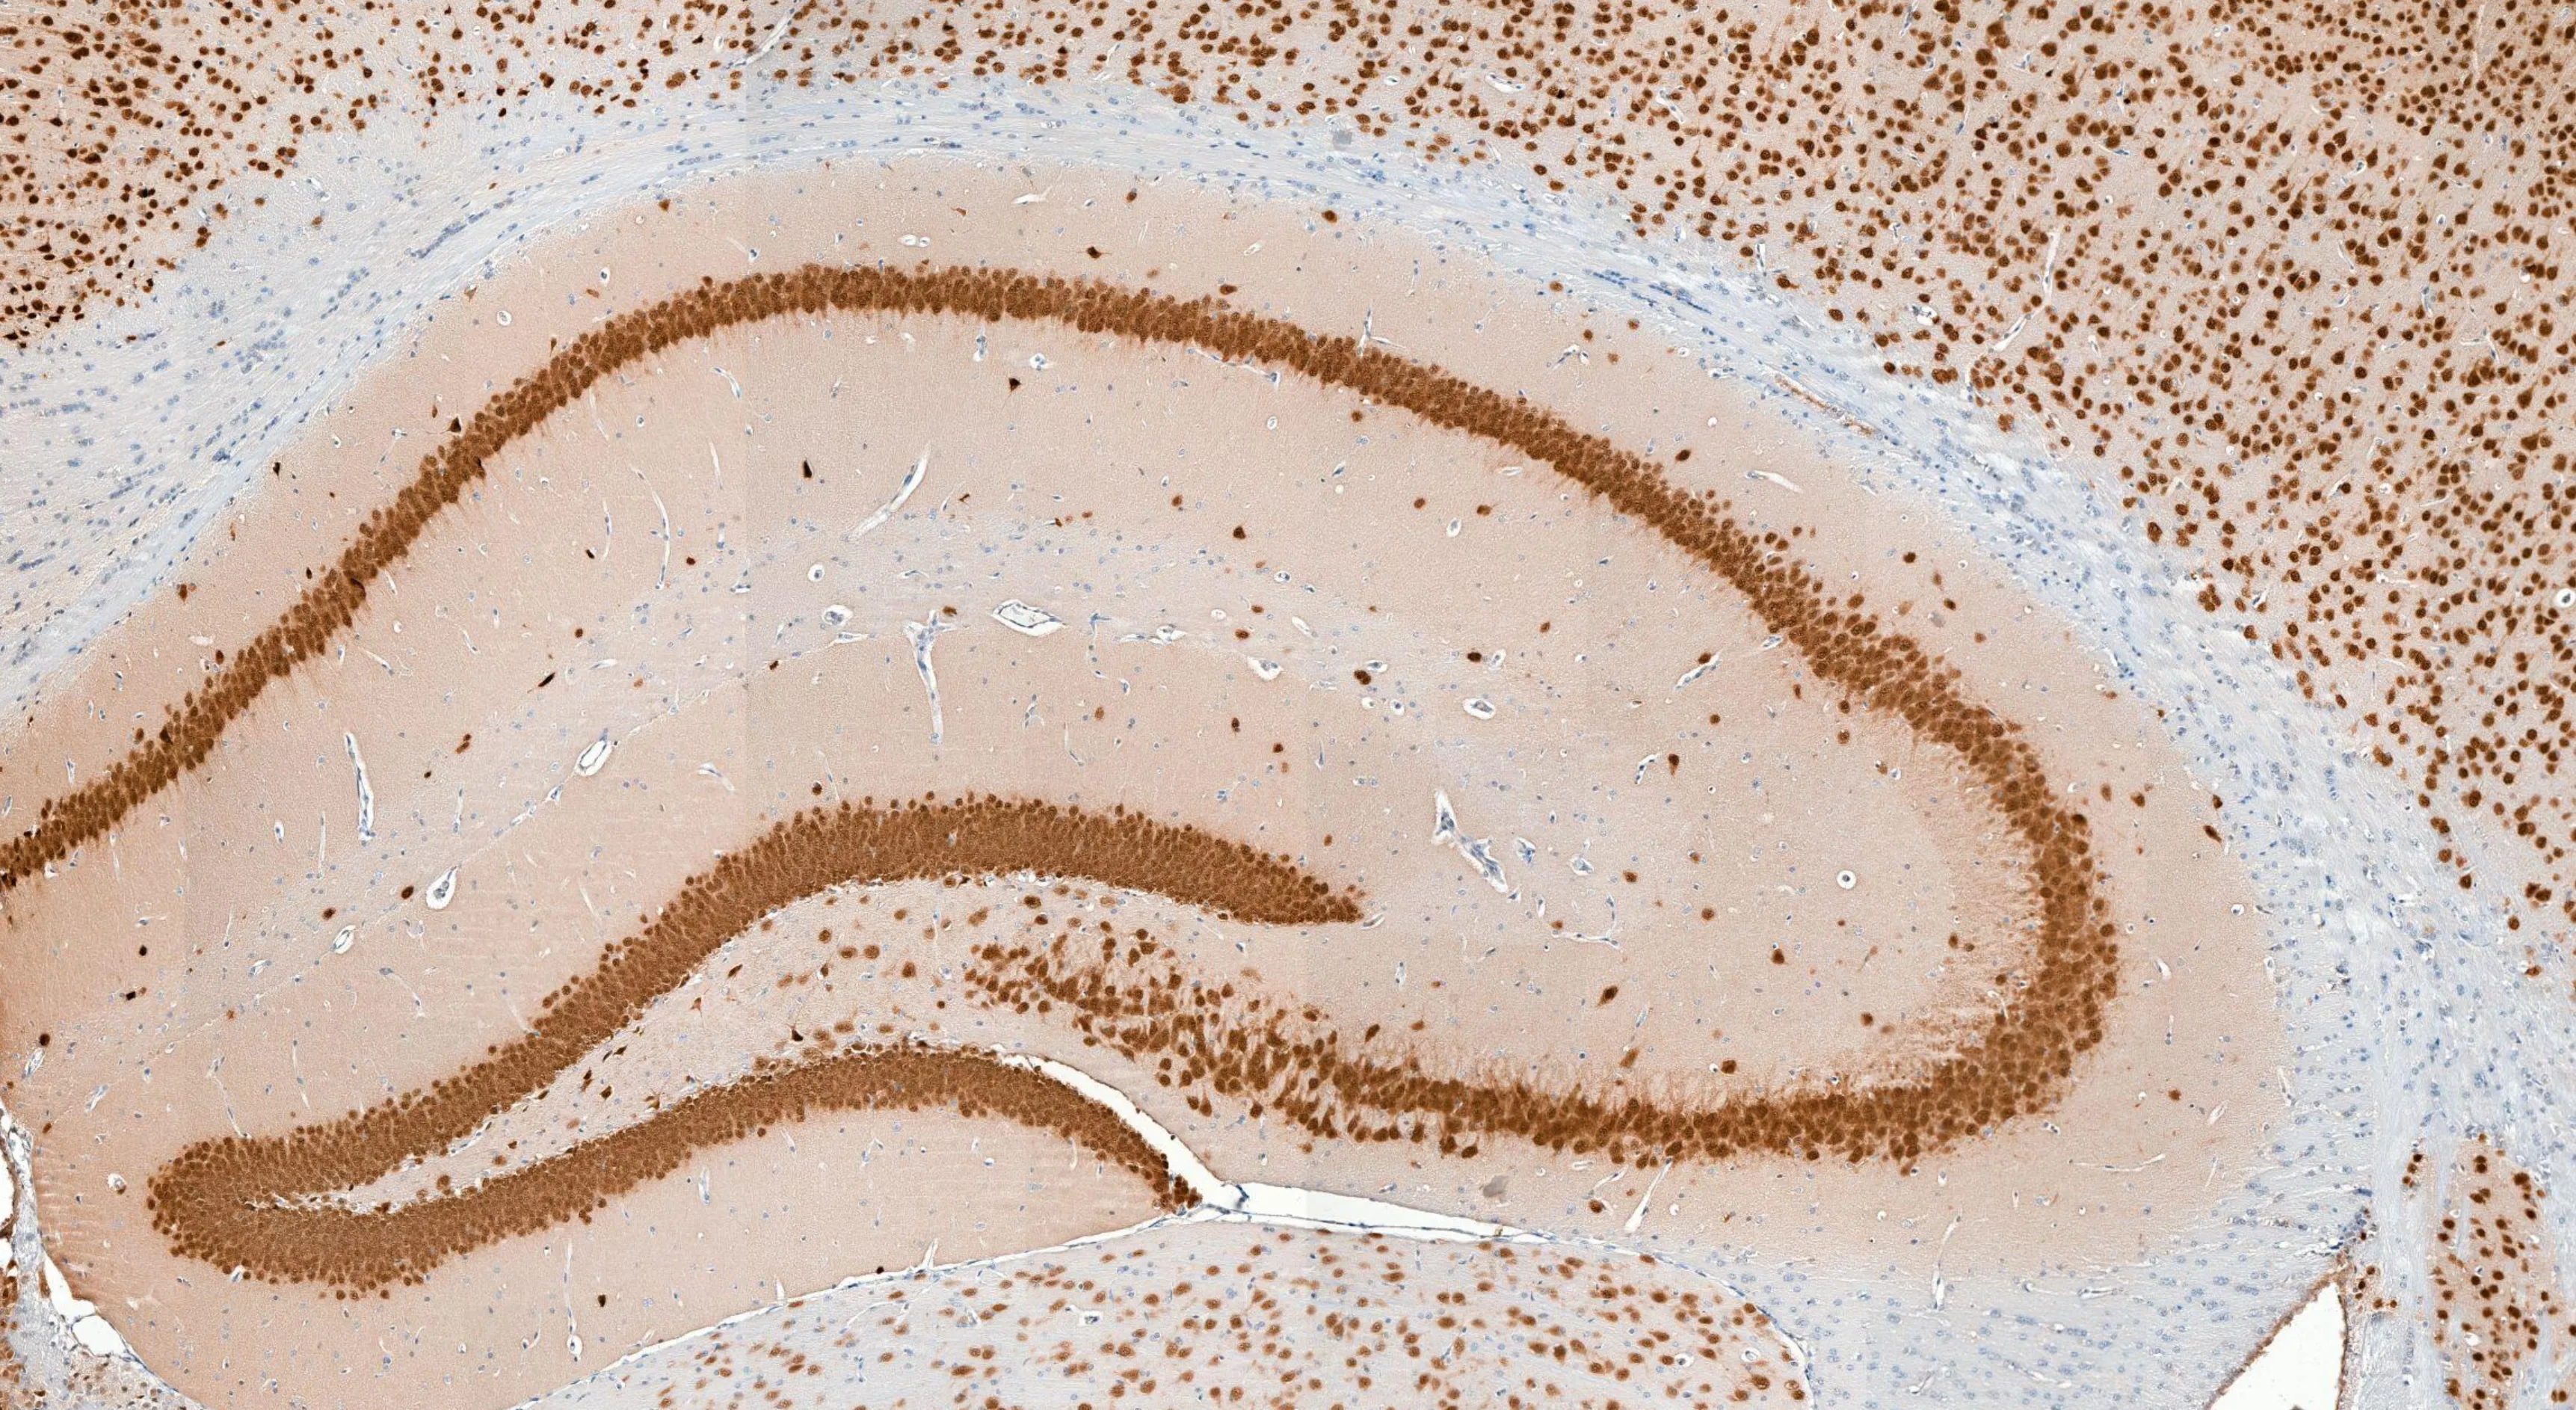 NeuN sectionDetected neurons
Cortex, hippocampus, thalamus and hypothalamus, delineated first
Every read-out that follows is reported inside those boundaries, so a density from one animal is comparable with the same density from the next, and sections cut at slightly different levels still report against the same compartments.
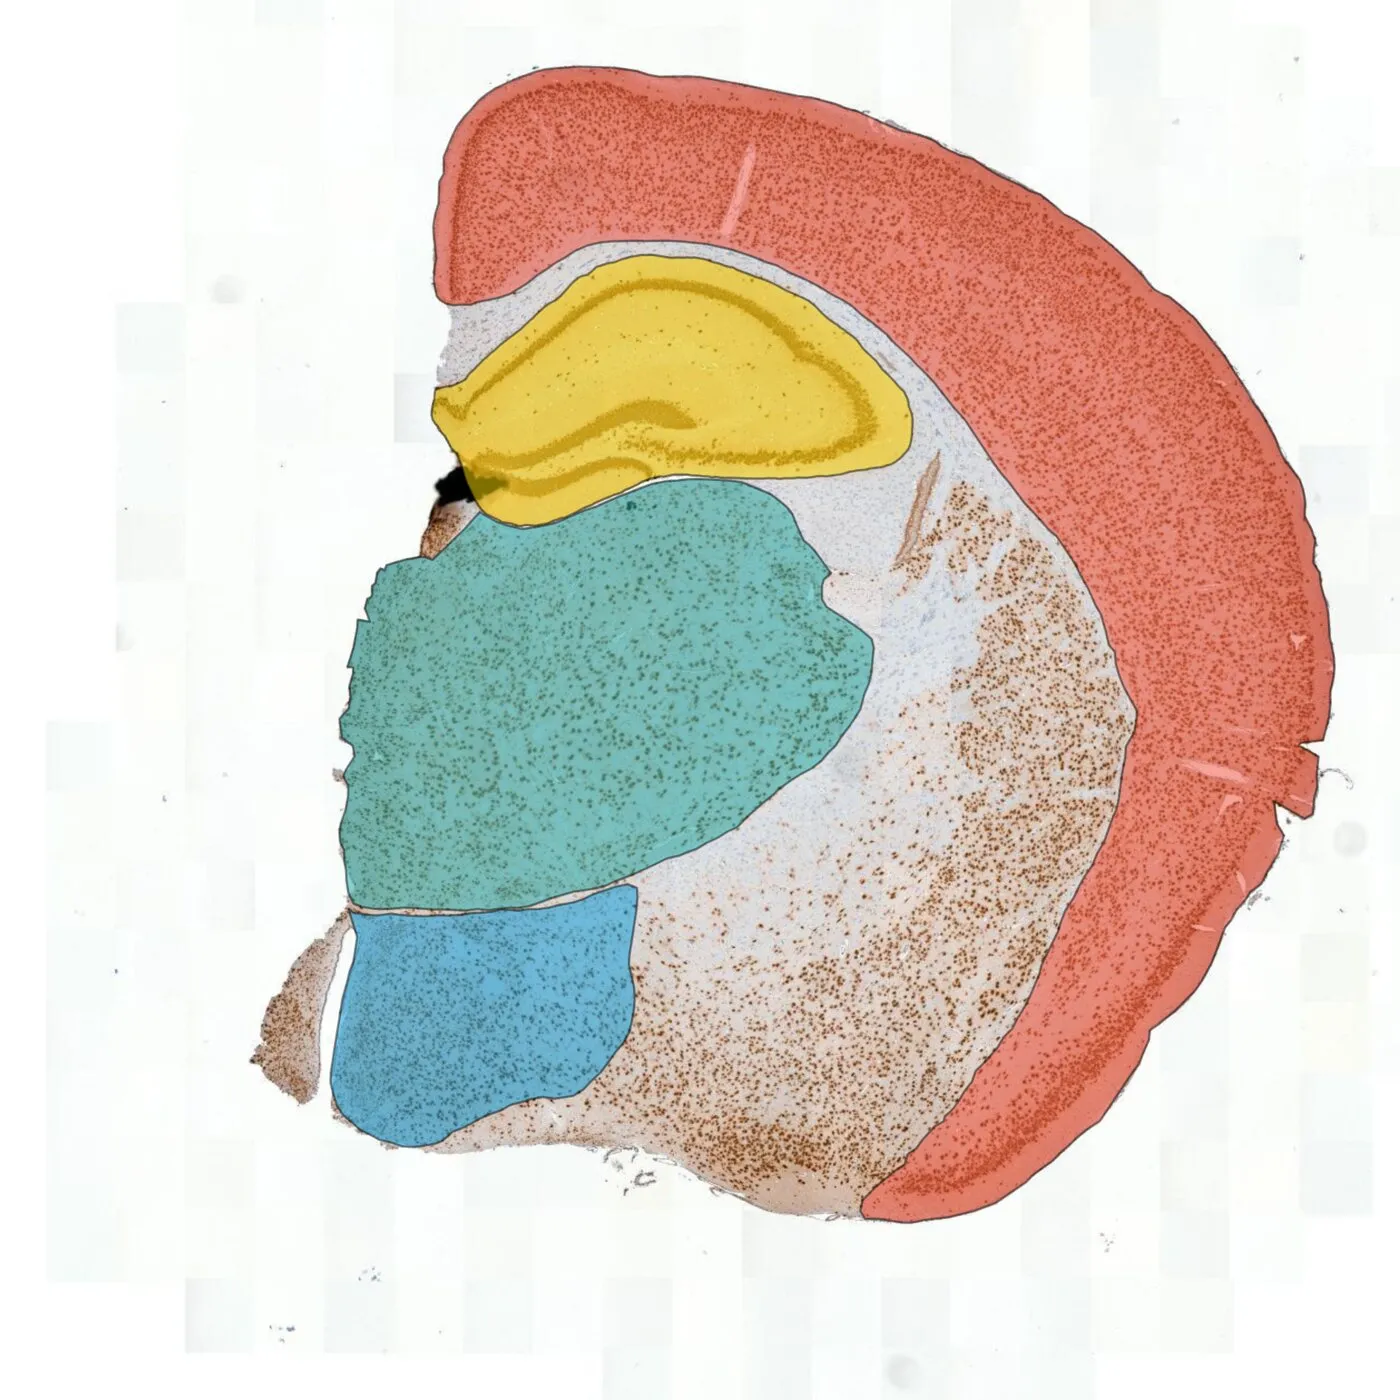
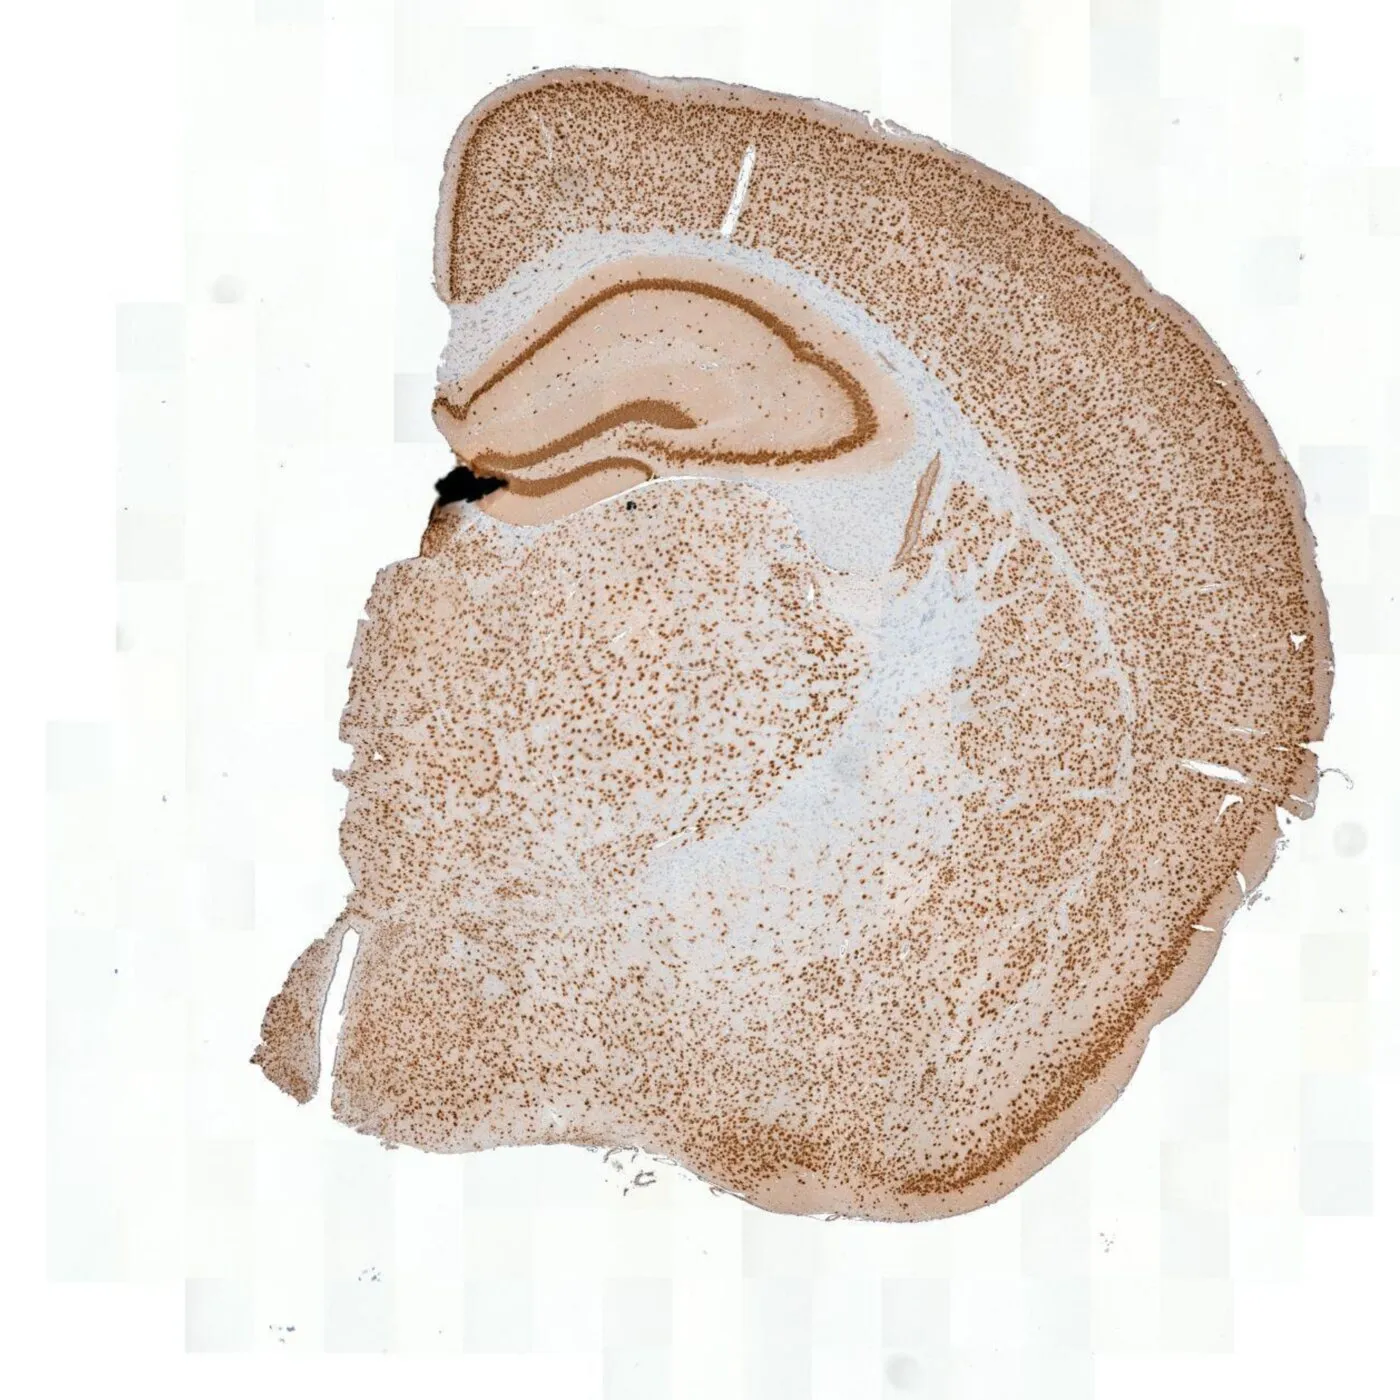 Stained sectionDelineated regions
- Cortex
- Hippocampus
- Thalamus
- Hypothalamus
Has neuron density changed, and where?
Every NeuN-positive neuron on the section is detected and attributed to the region it sits in, so neuron loss is reported as a density per region instead of an impression of a thinner band. The section in this figure carries more than 30,000 neurons, which is why this read-out is infeasible to produce by hand.
Is there neuroinflammation, and how is it distributed?
Iba1-positive cells are detected individually across the whole section, yielding microglial density per anatomical region rather than scores from manually selected fields. That makes a region-specific change visible and comparable across regions, not averaged into one section-wide number.
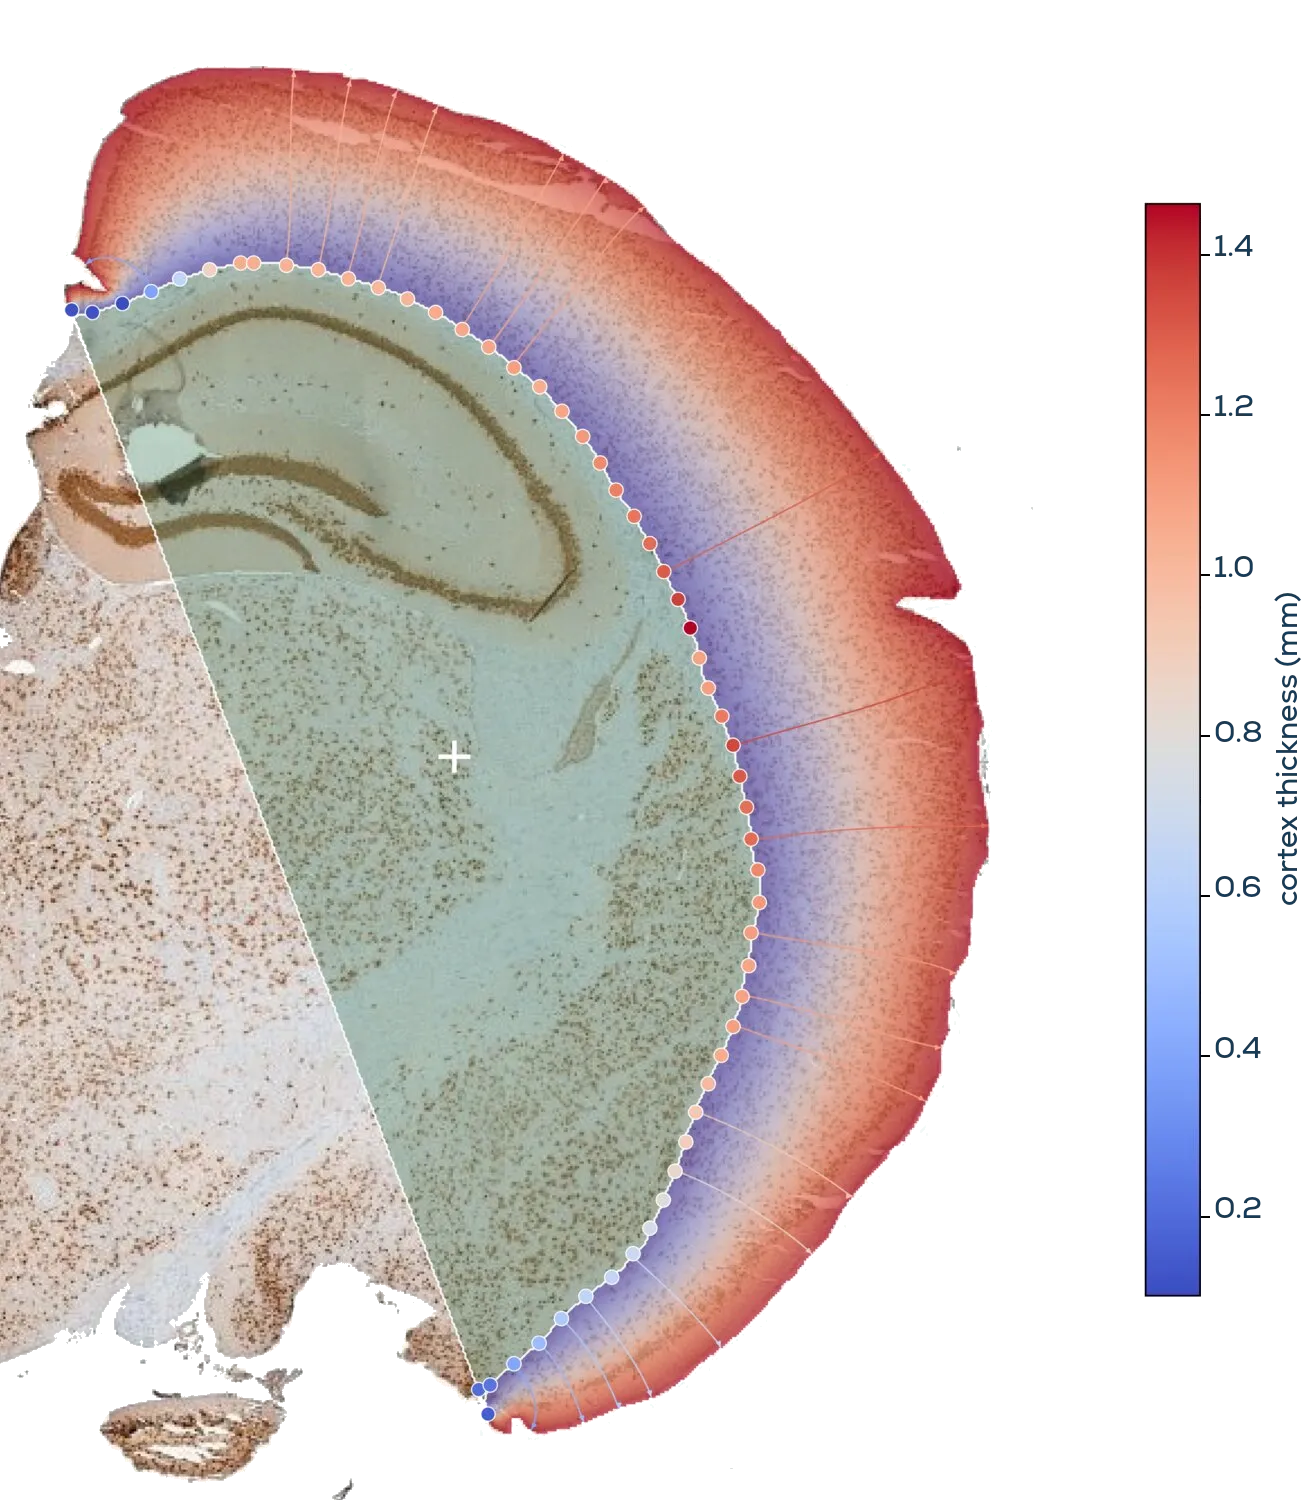
Cortical thickness, along the full ribbon
The same delineations that carry cell densities also carry structural measurements. Cortical thickness is the one we are asked for most, measured from the segmented cortex along the full ribbon rather than at a few points chosen by hand.
Which structural read-outs your study gets is settled when we scope it, against your sections and the endpoint you need. Tell us what the study turns on and we will tell you what we can measure for it.
Judge it on your own sections
The region models and the cell detectors were developed with pathologists and preclinical researchers who read brain tissue, on annotated sections.
The kidney and atherosclerosis read-outs each have a validation behind them. For brain, that comparison is not published, so the way to weigh these read-outs is your own tissue: send a handful of sections and you get the densities back with every detection visible on the image it came from, next to the counting you do today.
From slide to per-region read-out
Four steps. Your scanning workflow does not change, and no manual counting happens in between.
- 1
Whole-slide scan
Stained brain sections, digitized in the formats you already scan.
- 2
Regions mapped
Anatomical compartments are delineated across the full section.
- 3
Cells detected
Neurons and microglia are detected individually and assigned to a region.
- 4
Read-outs returned
Per-region densities, per animal and per experimental group, with the detections they were counted from.
A marker that is not on this page
Another antibody, another region set or a read-out specific to your model is built on your own images as custom AI development.
Co-developed with TNO Health & Work
Through our partnership, we co-develop these models together with TNO. Their preclinical and pharmaceutical research expertise sits behind the study design and the tissue, our AI behind the read-outs, and the models are applied within TNO's preclinical studies with more study areas in development.
Continue with another tissue
Biopharma overview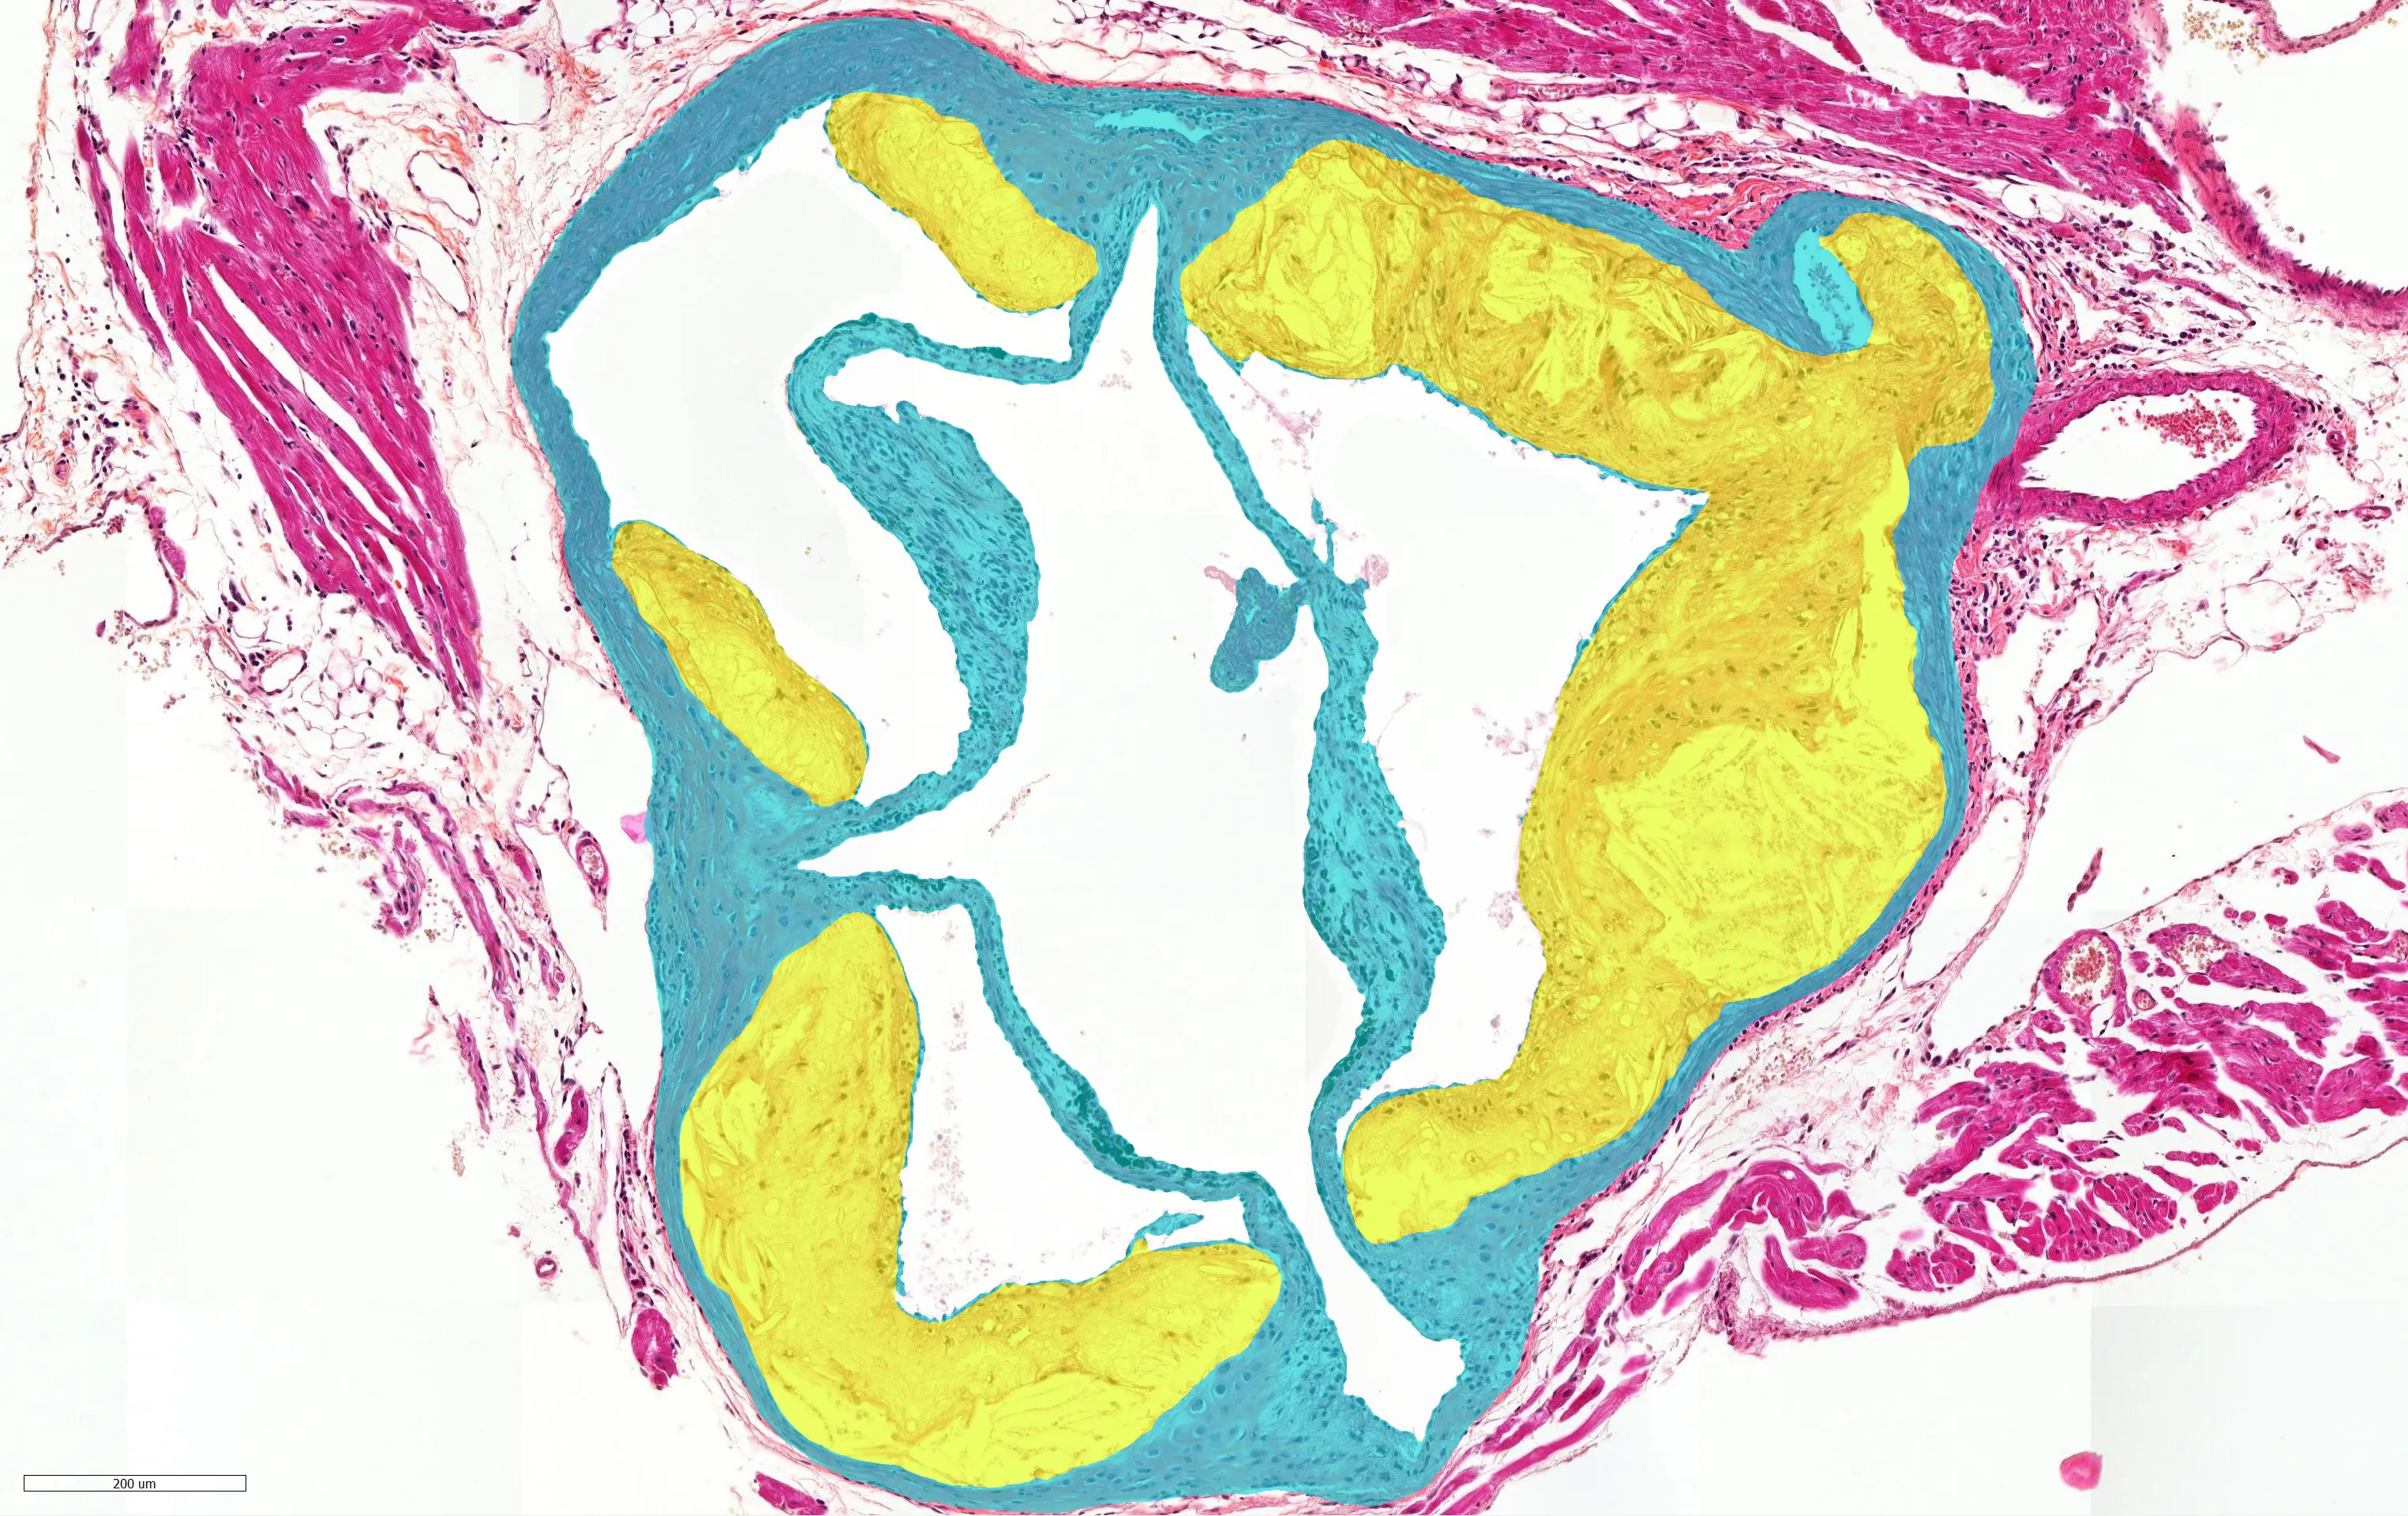 AtherosclerosisLesion area, whole cross-section
- BrainNeuron density per region
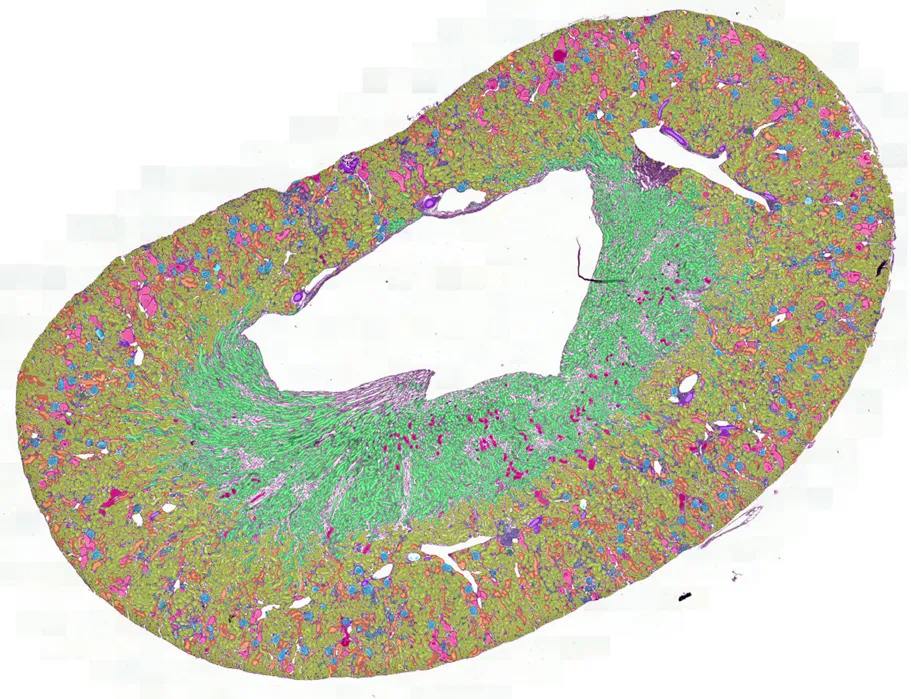 NephroPath (kidney)Every glomerulus, scored
 LiverFibrosis extent
Bring us a brain cohort
Tell us the marker and the regions you need quantified. We will return the read-outs on a few of your own sections so you can judge them against your current counting.
Message sent
Thank you. We will get back to you.