
Digital slide quality assessments,no integration required
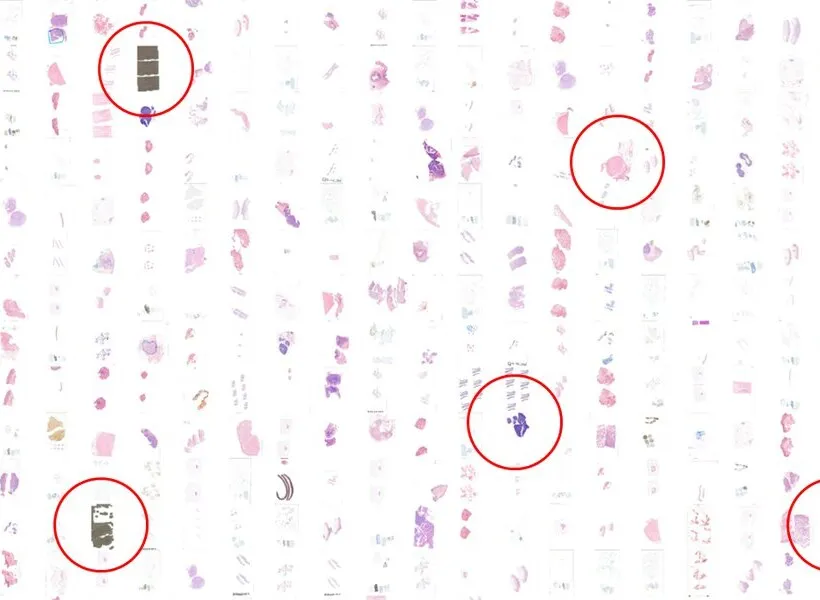
Artifacts and missed tissue areas introduced in preparation and scanning are rarely visible at the scale a batch is reviewed. Upload whole-slide images to the Aiosyn platform and the analysis runs outside your systems, with no connection to your image management system and nothing installed in the laboratory.
In the EU and the UK, AiosynQC is not a medical device under IVDR and UK MDR 2002. Research Use Only in the United States.
- Secure upload
- H&E, IHC, and other special stains
- One-off or at your own interval
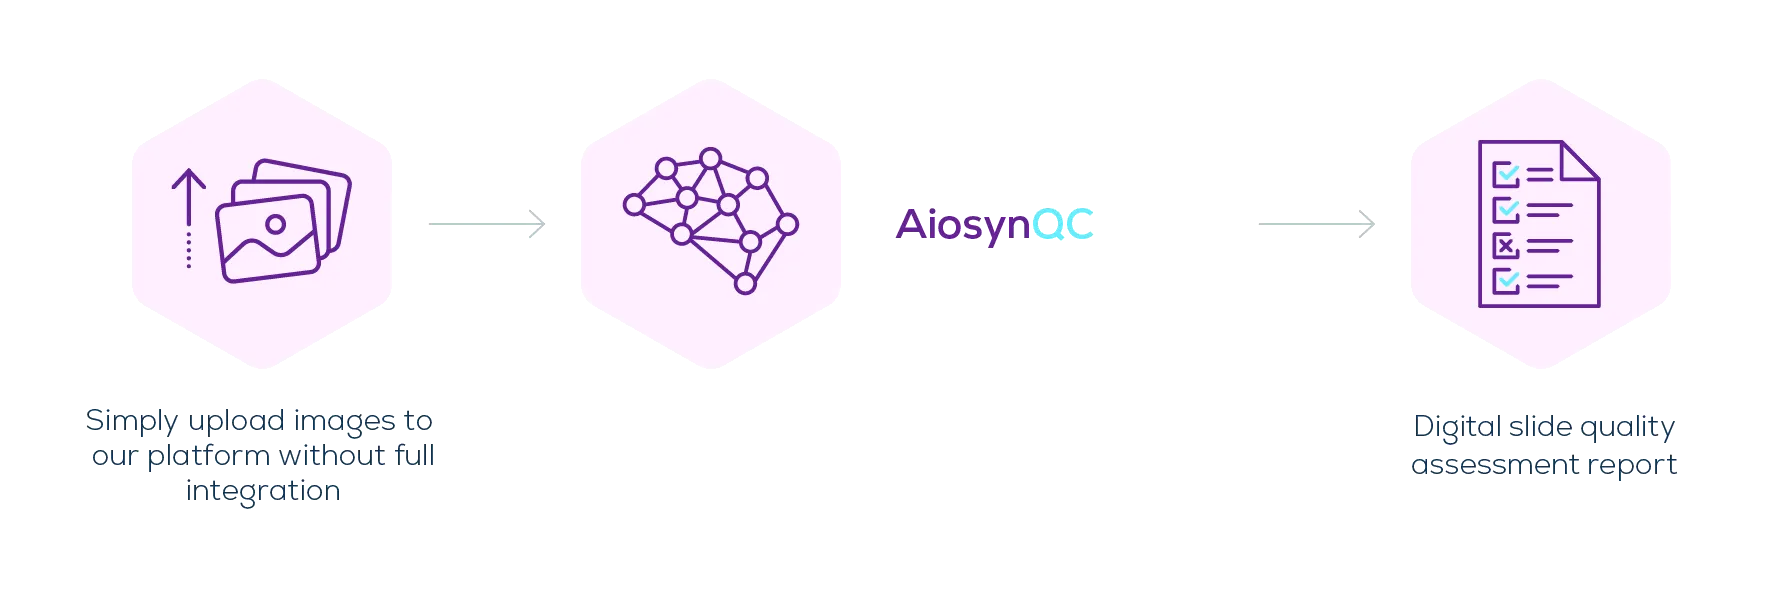
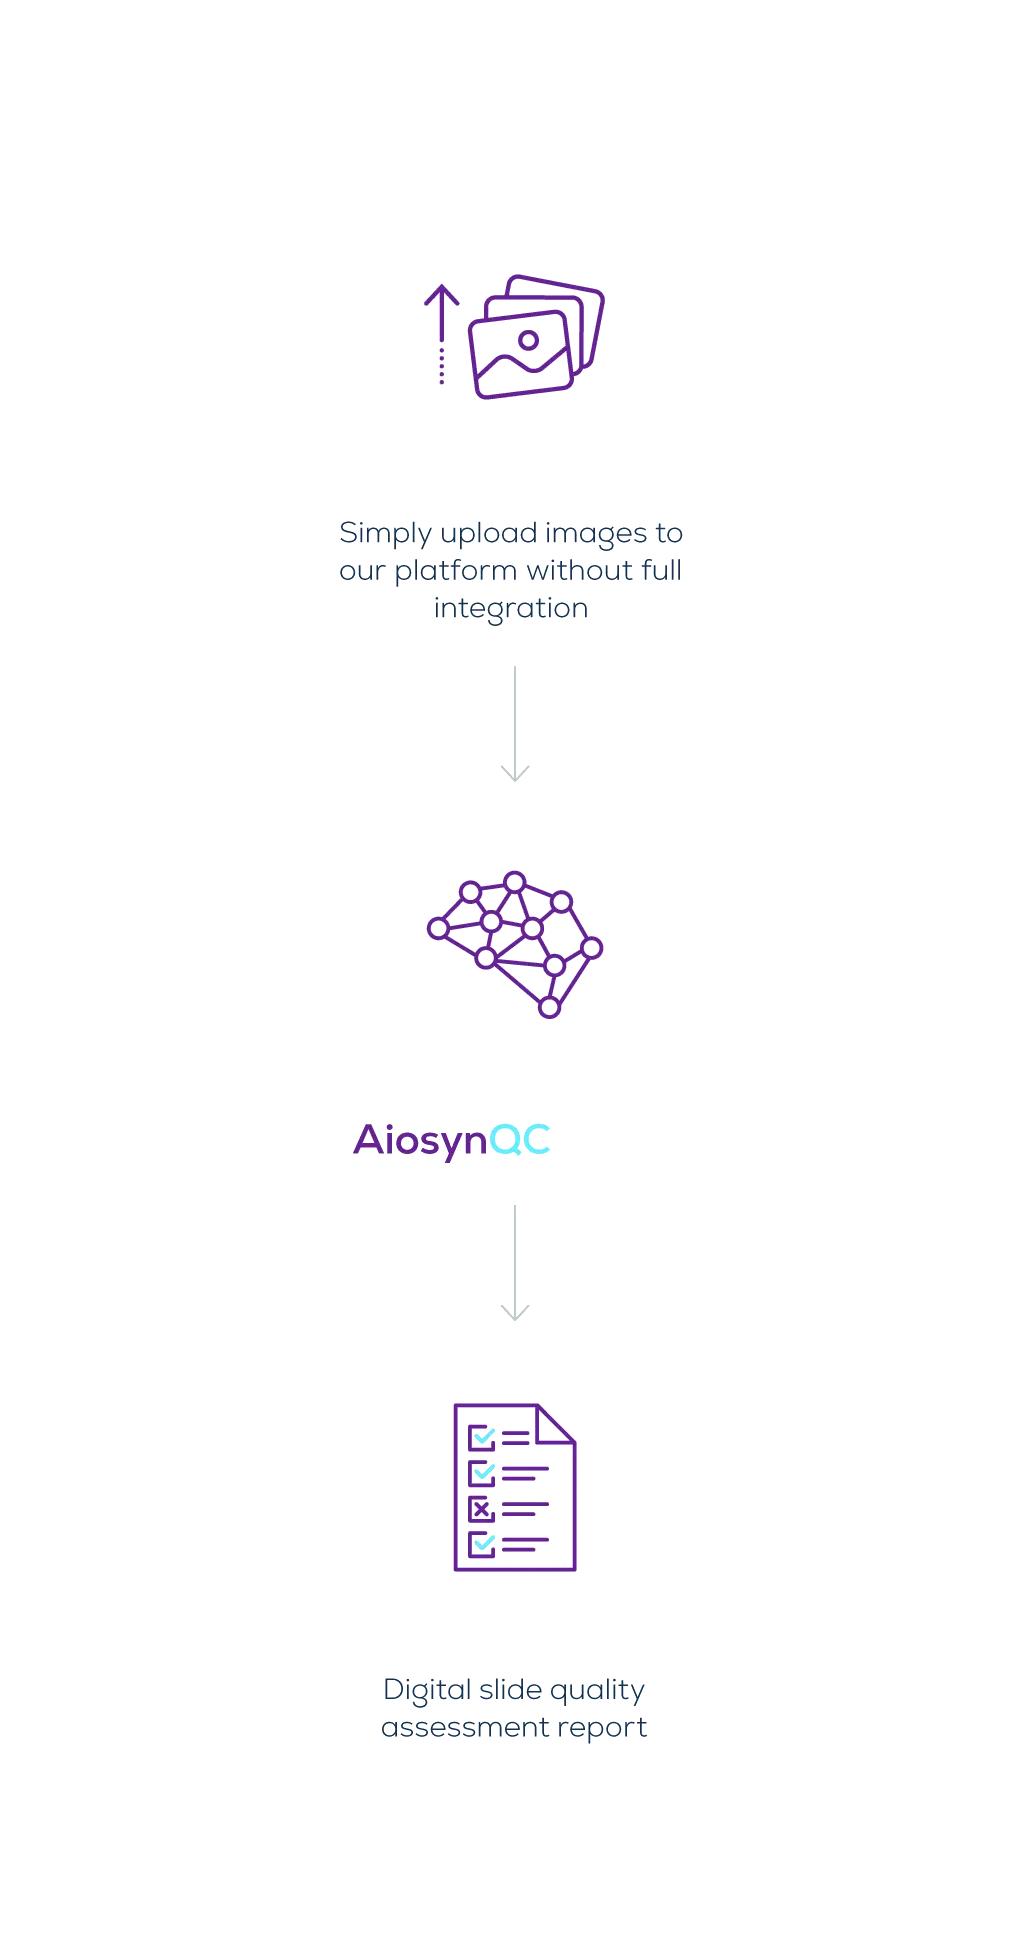
From uploaded batch to assessment report
You upload the batch. The algorithm analyzes every image at pixel level and segments the regions it flags. The assessment comes back as a report, with each image openable in the viewer.
Assessments run one-off, before an accreditation audit or after a change of scanner, or at a fixed interval where the record matters more than the single batch.
The assessment arrives as a report
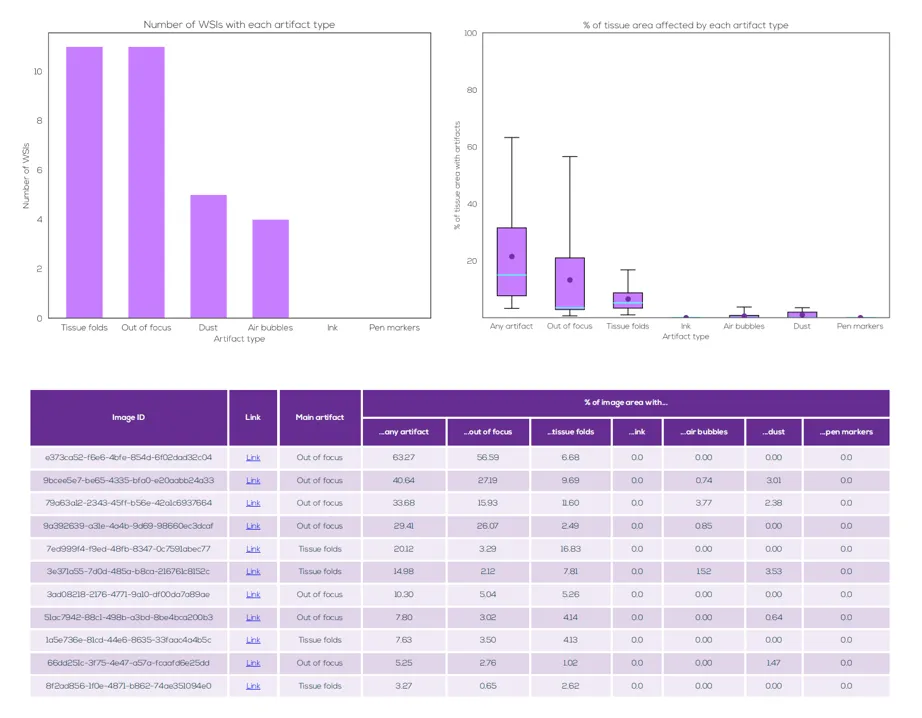
Quantified per class and per image, so the batch can be judged as a whole and the images that need a new preparation or a rescan are named.
- Artifact prevalence across the batch, per class
- Share of tissue area affected, per class and per image
- One row per image, linking into the viewer
- Comparison against your own earlier assessments
Aiosyn publishes no full example report. We walk through a recent one on a call.
The classes AiosynQC segments
The assessment runs the algorithm laboratories run in production, at the sensitivity set for your batch.
- Out-of-focus areas
- Incomplete scanning
- Air bubbles
- Tissue folds
- Pen markers
- Dust
- White balance problems
- Ink
Support for ISO 15189 and ISO 17025 accreditation
Artifact prevalence measured the same way on every batch is quantified evidence for a quality system, and it points staff training at the classes that dominate rather than at the ones that are easiest to see.
Send us a batch
Upload a set of whole-slide images and we will return the assessment of it, with nothing to install and nothing to connect.