
Digital kidney pathology,quantified by AI
NephroPath evaluates histological biomarkers in preclinical and clinical kidney samples. Every glomerulus, tubule and fibrotic region in the section is scored the same way every time, which makes renal biomarker read-outs reproducible where traditional pathologist scoring varies between readers.
NephroPath is for Research Use Only and should not be used for diagnostic procedures.
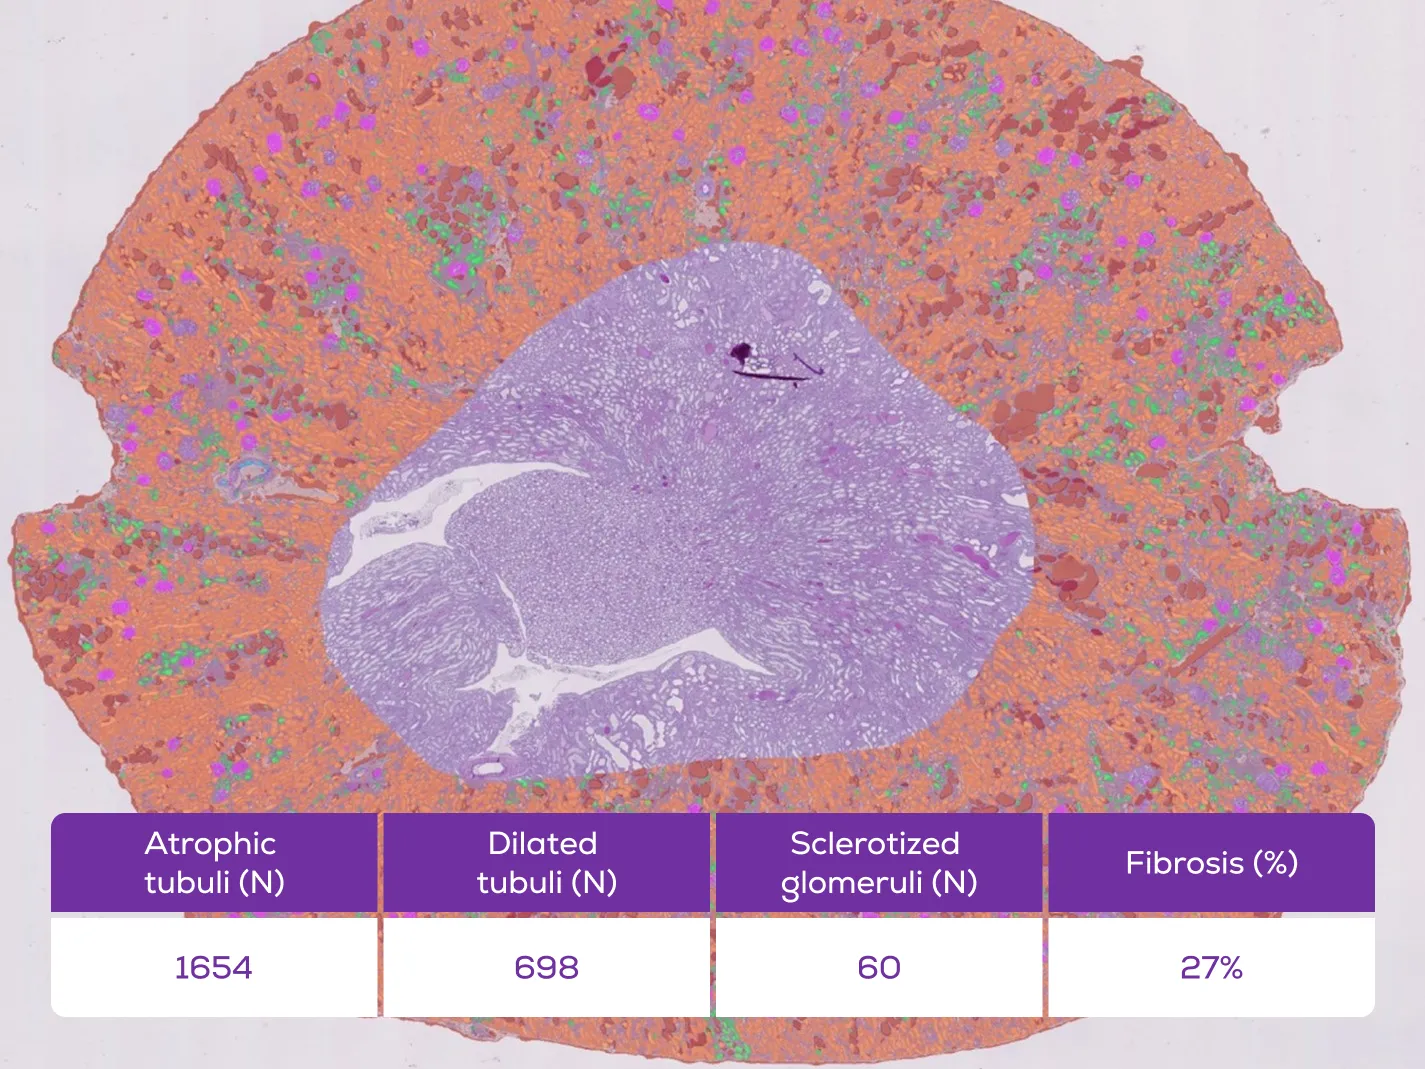
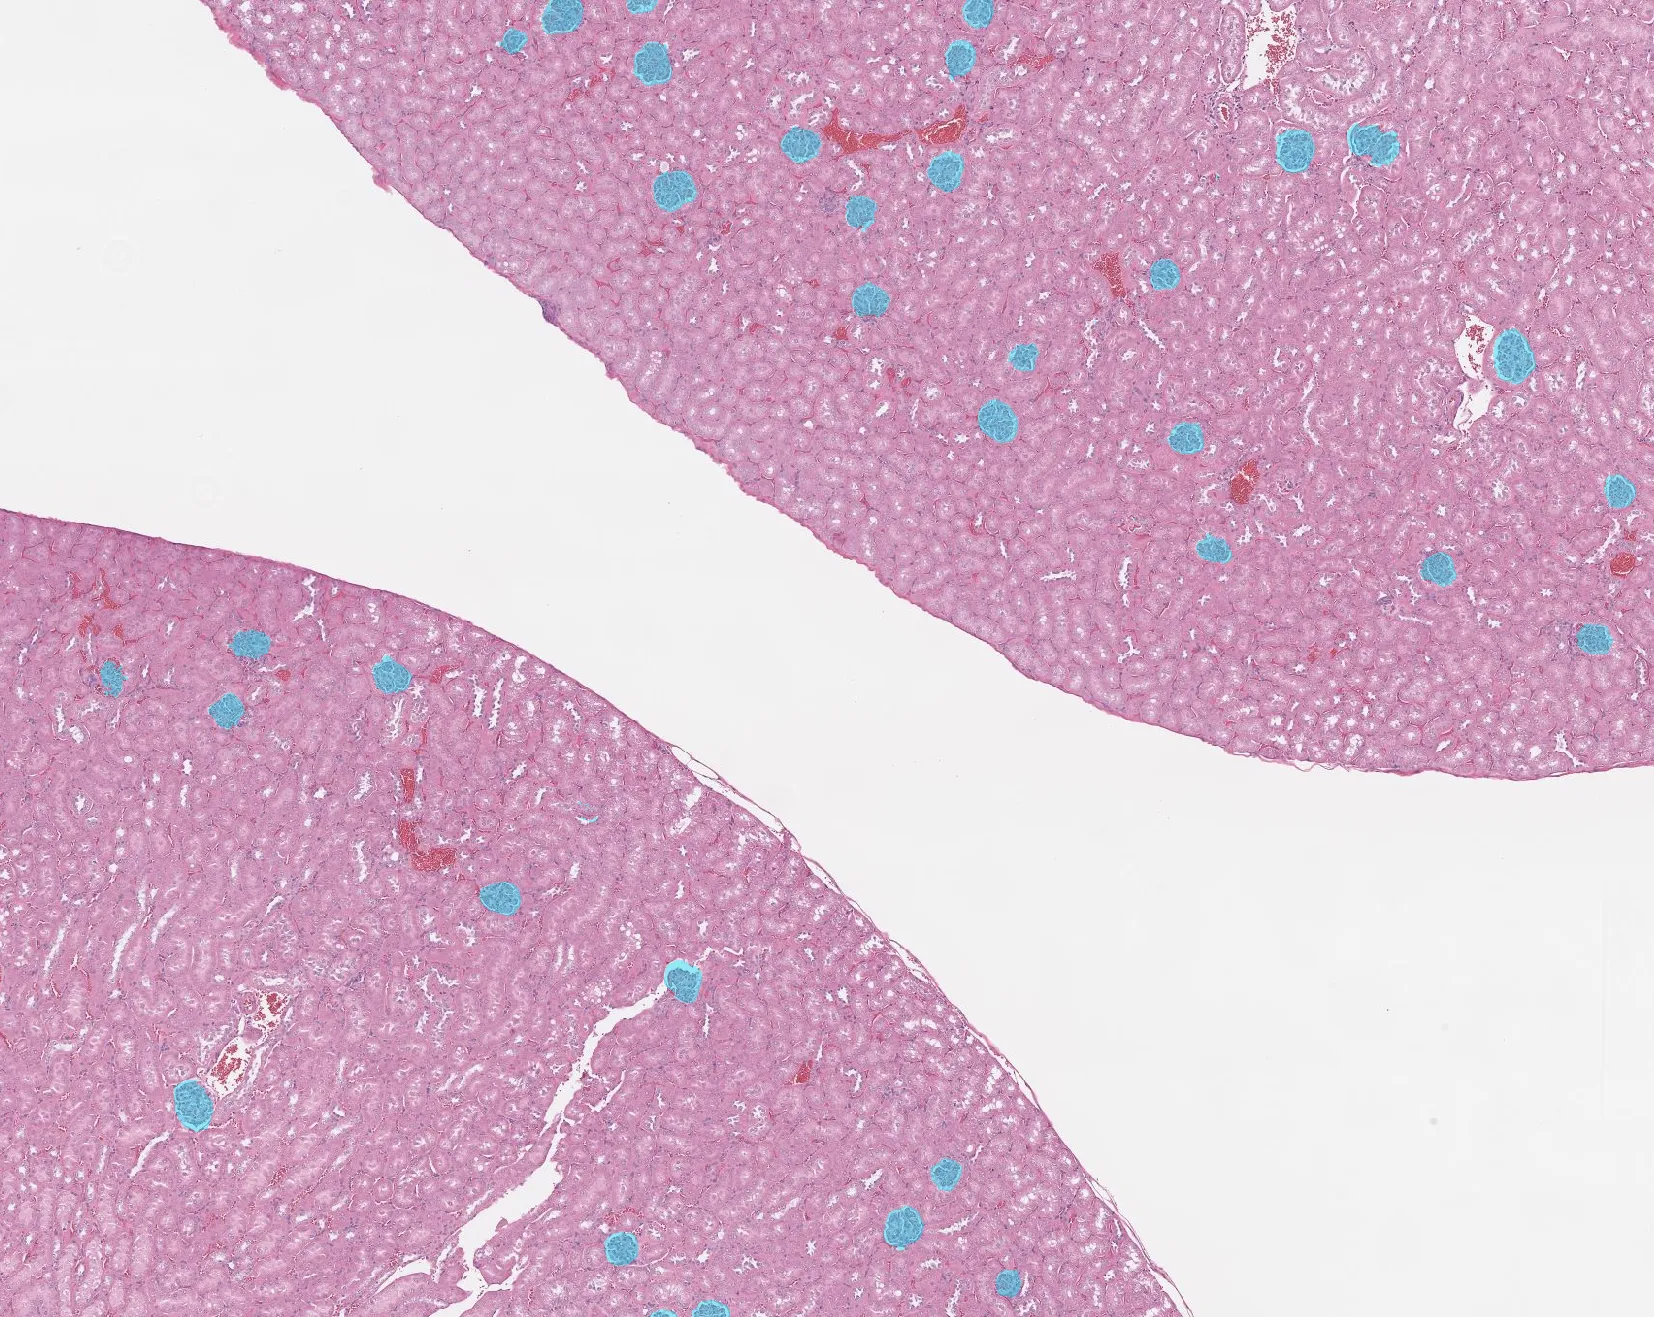
Multi-class prediction and quantification across an entire rat kidney cortex.
Segmentation of main tissue classes
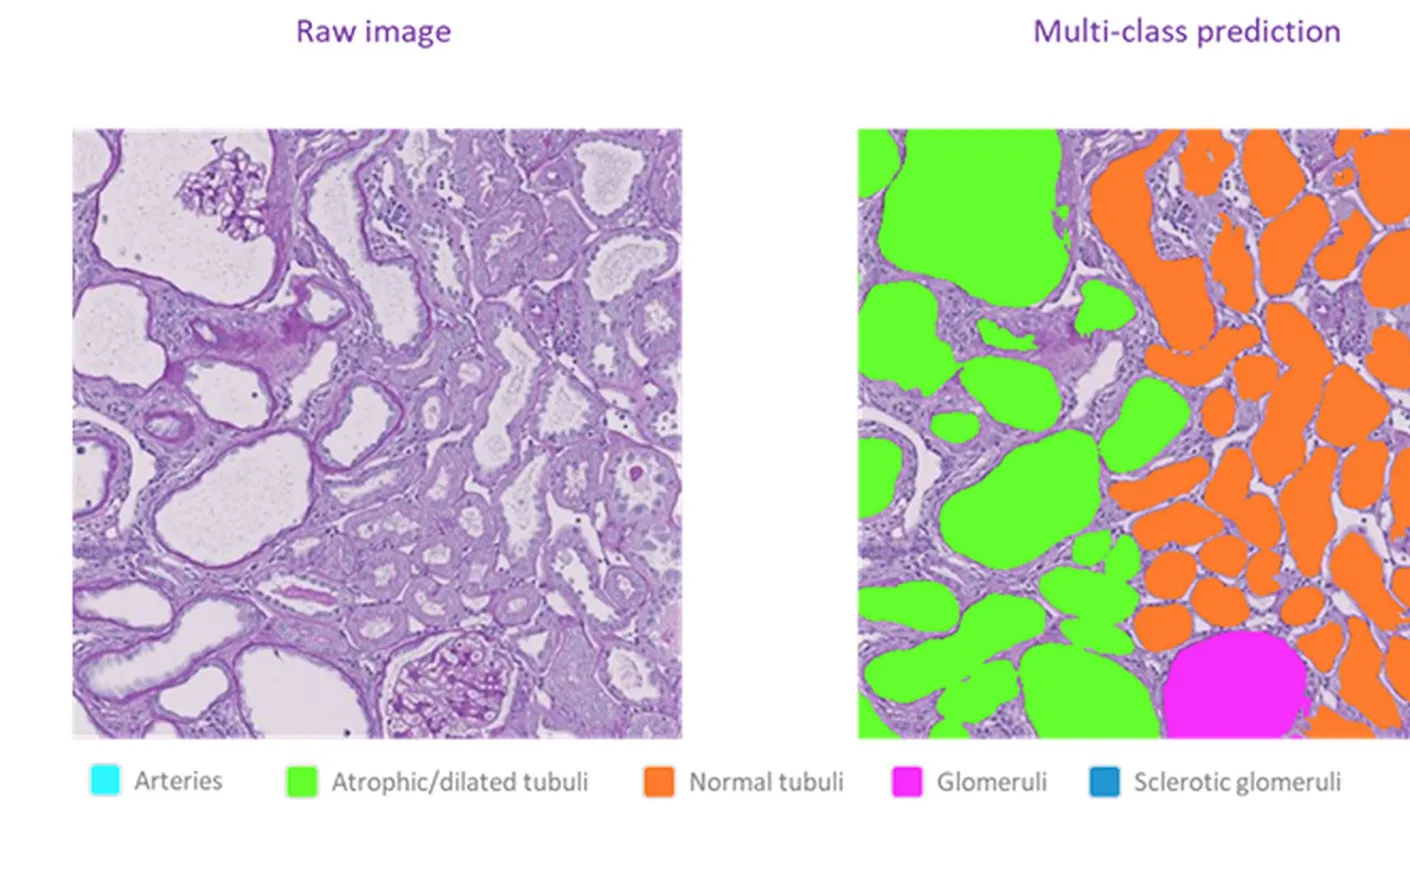
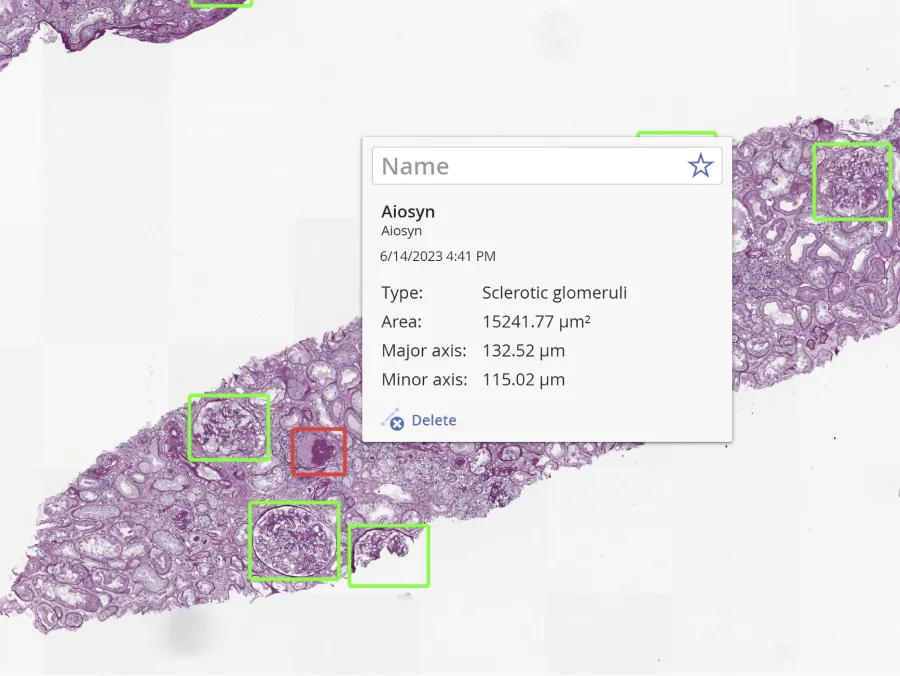
NephroPath delineates the structures a renal pathologist reads from: glomeruli and sclerotic glomeruli, proximal, distal and atrophic tubuli, arteries and the capsule. Those delineations carry every measurement that follows, from the number of glomeruli in a biopsy to the share of tissue that is interstitium.
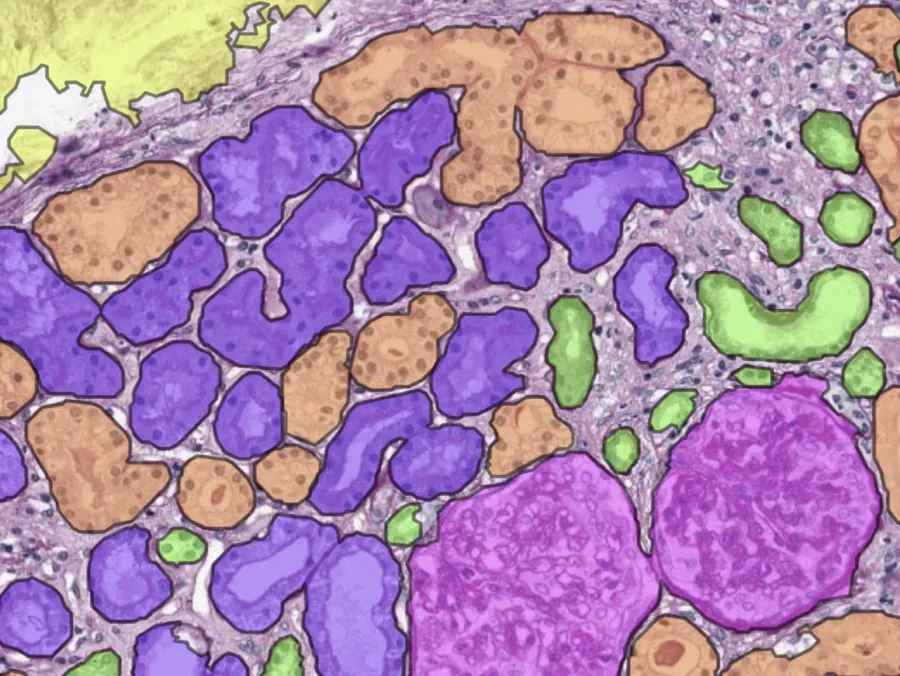
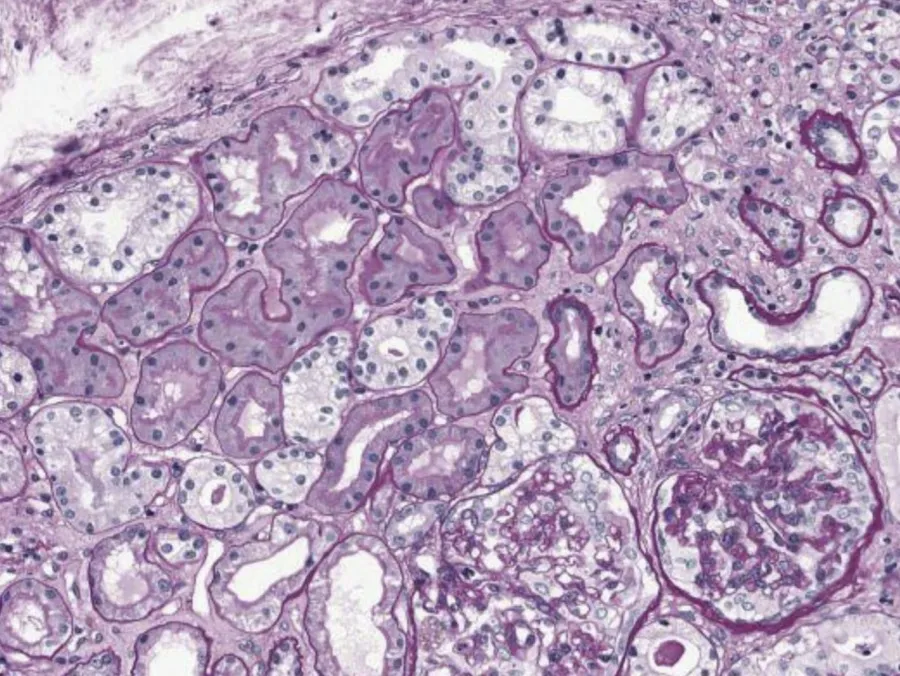 PAS sectionClassified structures
AI-powered quantification of fibrosis
Renal fibrosis is a key biomarker for chronic kidney disease progression and for the prognosis of kidney transplantation. Semi-quantitative scoring systems are limited to what the eye can estimate across a few fields. NephroPath measures the fibrotic area itself, giving pathologists and biopharma teams a precise figure in place of a grade.
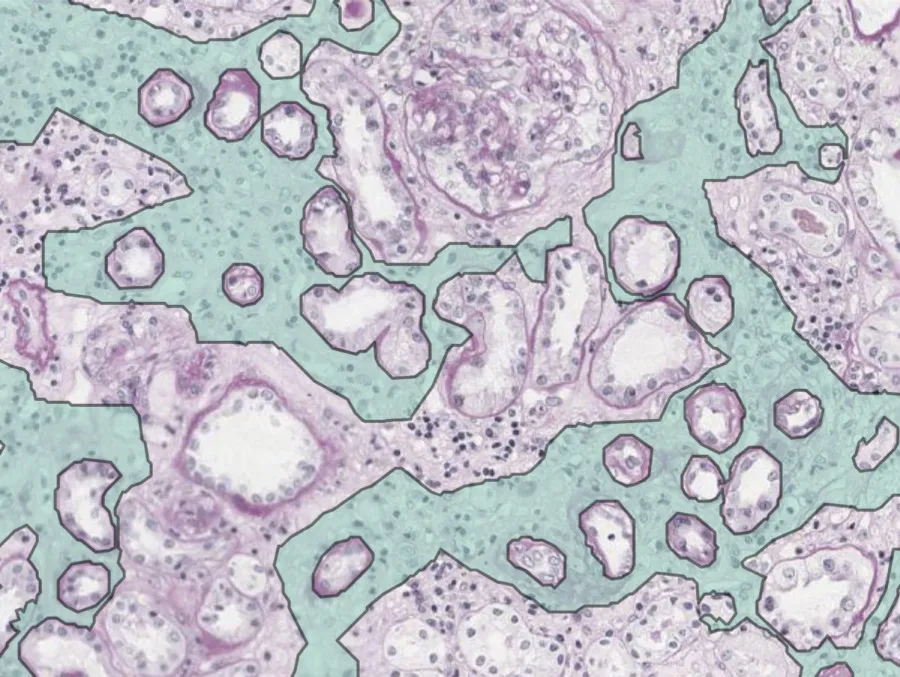
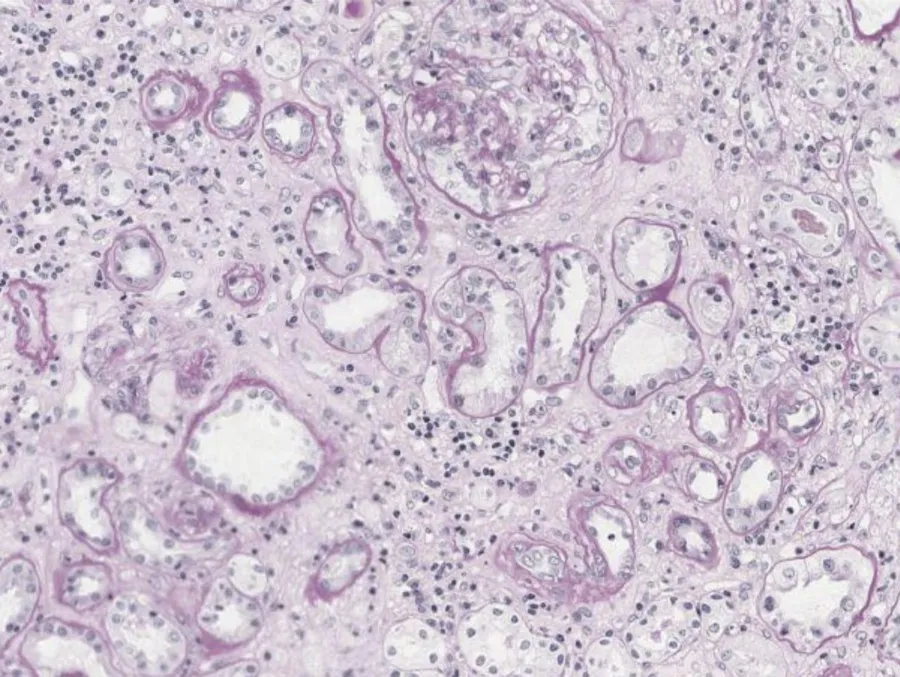 Kidney sectionFibrotic area
Kidney lesions, quantified in a diabetic nephropathy model
Physiogenex ran a ten-week dapagliflozin study in the SDT fatty rat, a model of type 2 diabetic kidney disease. NephroPath quantified glomerulosclerosis and tubular impairment across the sections.
Compared with the classical histology analysis and scoring, utilizing the Aiosyn NephroPath platform has not only enhanced the precision of our preclinical studies but has also significantly reduced the time required to analyze kidney tissue samples.
Director Research and Business Development, Physiogenex
Peer-reviewed study

Quantitative image analysis showed dapagliflozin’s benefit on glomerulosclerosis
Every glomerulus and tubule was scored across the section rather than in a handful of sampled fields, which is what separated the treated and control groups.
Briand F, et al. · European Journal of Pharmaceutical Sciences · 224 · 2026
Read the studyThe kidney work is guided by our scientific advisory board
The kidney models are developed with pathologists and clinician researchers who read renal tissue.

Jesper Kers, MD, PhD
Amsterdam and Leiden University Medical Centers
Consultant pathologist in kidney, immuno- and transplant pathology, leading a research group on decision support for nephrological disease.

Maarten Naesens, MD, PhD
University Hospitals Leuven and KU Leuven
Nephrologist and translational researcher in kidney transplantation, with more than 240 peer-reviewed articles in the field.

Mark D. Stegall, MD
Mayo Clinic
Transplant surgeon and researcher developing quantitative, objective methods for evaluating renal biopsies.
AI-assisted kidney image analysis services
Whole-slide images in, a quantified report out. You keep your scanning workflow; we run the analysis and return biomarker scores with the visual results behind them.
- 1
You share whole-slide images
Upload the images in the formats you already scan. No change to staining or scanning protocols.
- 2
The analysis runs
Structures are segmented across the whole section, then glomerulosclerosis, fibrosis extent and cell counts are quantified from those delineations.
- 3
You receive the report
Biomarker scores and visual results, broken down per experimental group for ongoing studies, with access to every result online or offline.
When the standard analysis does not fit
Kidney models can be built for a specific study: IHC and biomarker quantification in a particular animal model, treatment response grouping, or tissue microenvironment analysis. That work runs as custom AI development, with prototyping and a short turnaround.
The most frequent questions about NephroPath
Does your analysis cover the traditional Banff scoring?
Our AI-powered analysis aims to cover all Banff lesion scores over time. At present we provide some of the scores, among which atrophic tubuli (ct) and interstitial fibrosis (ci).
What stains are supported?
NephroPath currently supports five stains: PAS, H&E, Picrosirius Red, Trichrome and Silver Jones.
What sample types have been used to train the algorithms?
Our algorithms have been primarily trained on mouse, rat and human tissue. Since kidney structures are often highly conserved across species, the algorithm may still perform well on other species. We recommend validating performance on your specific samples to ensure optimal results.
What magnification levels does the algorithm work with, and how does this affect scanner compatibility?
The algorithm has been trained at a range of 0.85 to 1.15 µm per pixel. That spacing is generally available from a whole-slide image on most scanners.
How does NephroPath differentiate itself from other AI solutions on the market?
Most existing kidney analysis tools focus on assessing pre-implantation kidney health. NephroPath evaluates post-implantation kidney health using Banff criteria, providing insight into transplant pathology.
Are NephroPath’s algorithms CE-marked?
No. NephroPath is currently for Research Use Only and should not be used for diagnostic procedures.
What pricing models are available?
Pricing is set against your needs and volumes. Per-project, per-slide and subscription-based models are all available. Contact us and we will scope it with you.
NephroPath in the news

Continue with another tissue
Biopharma overview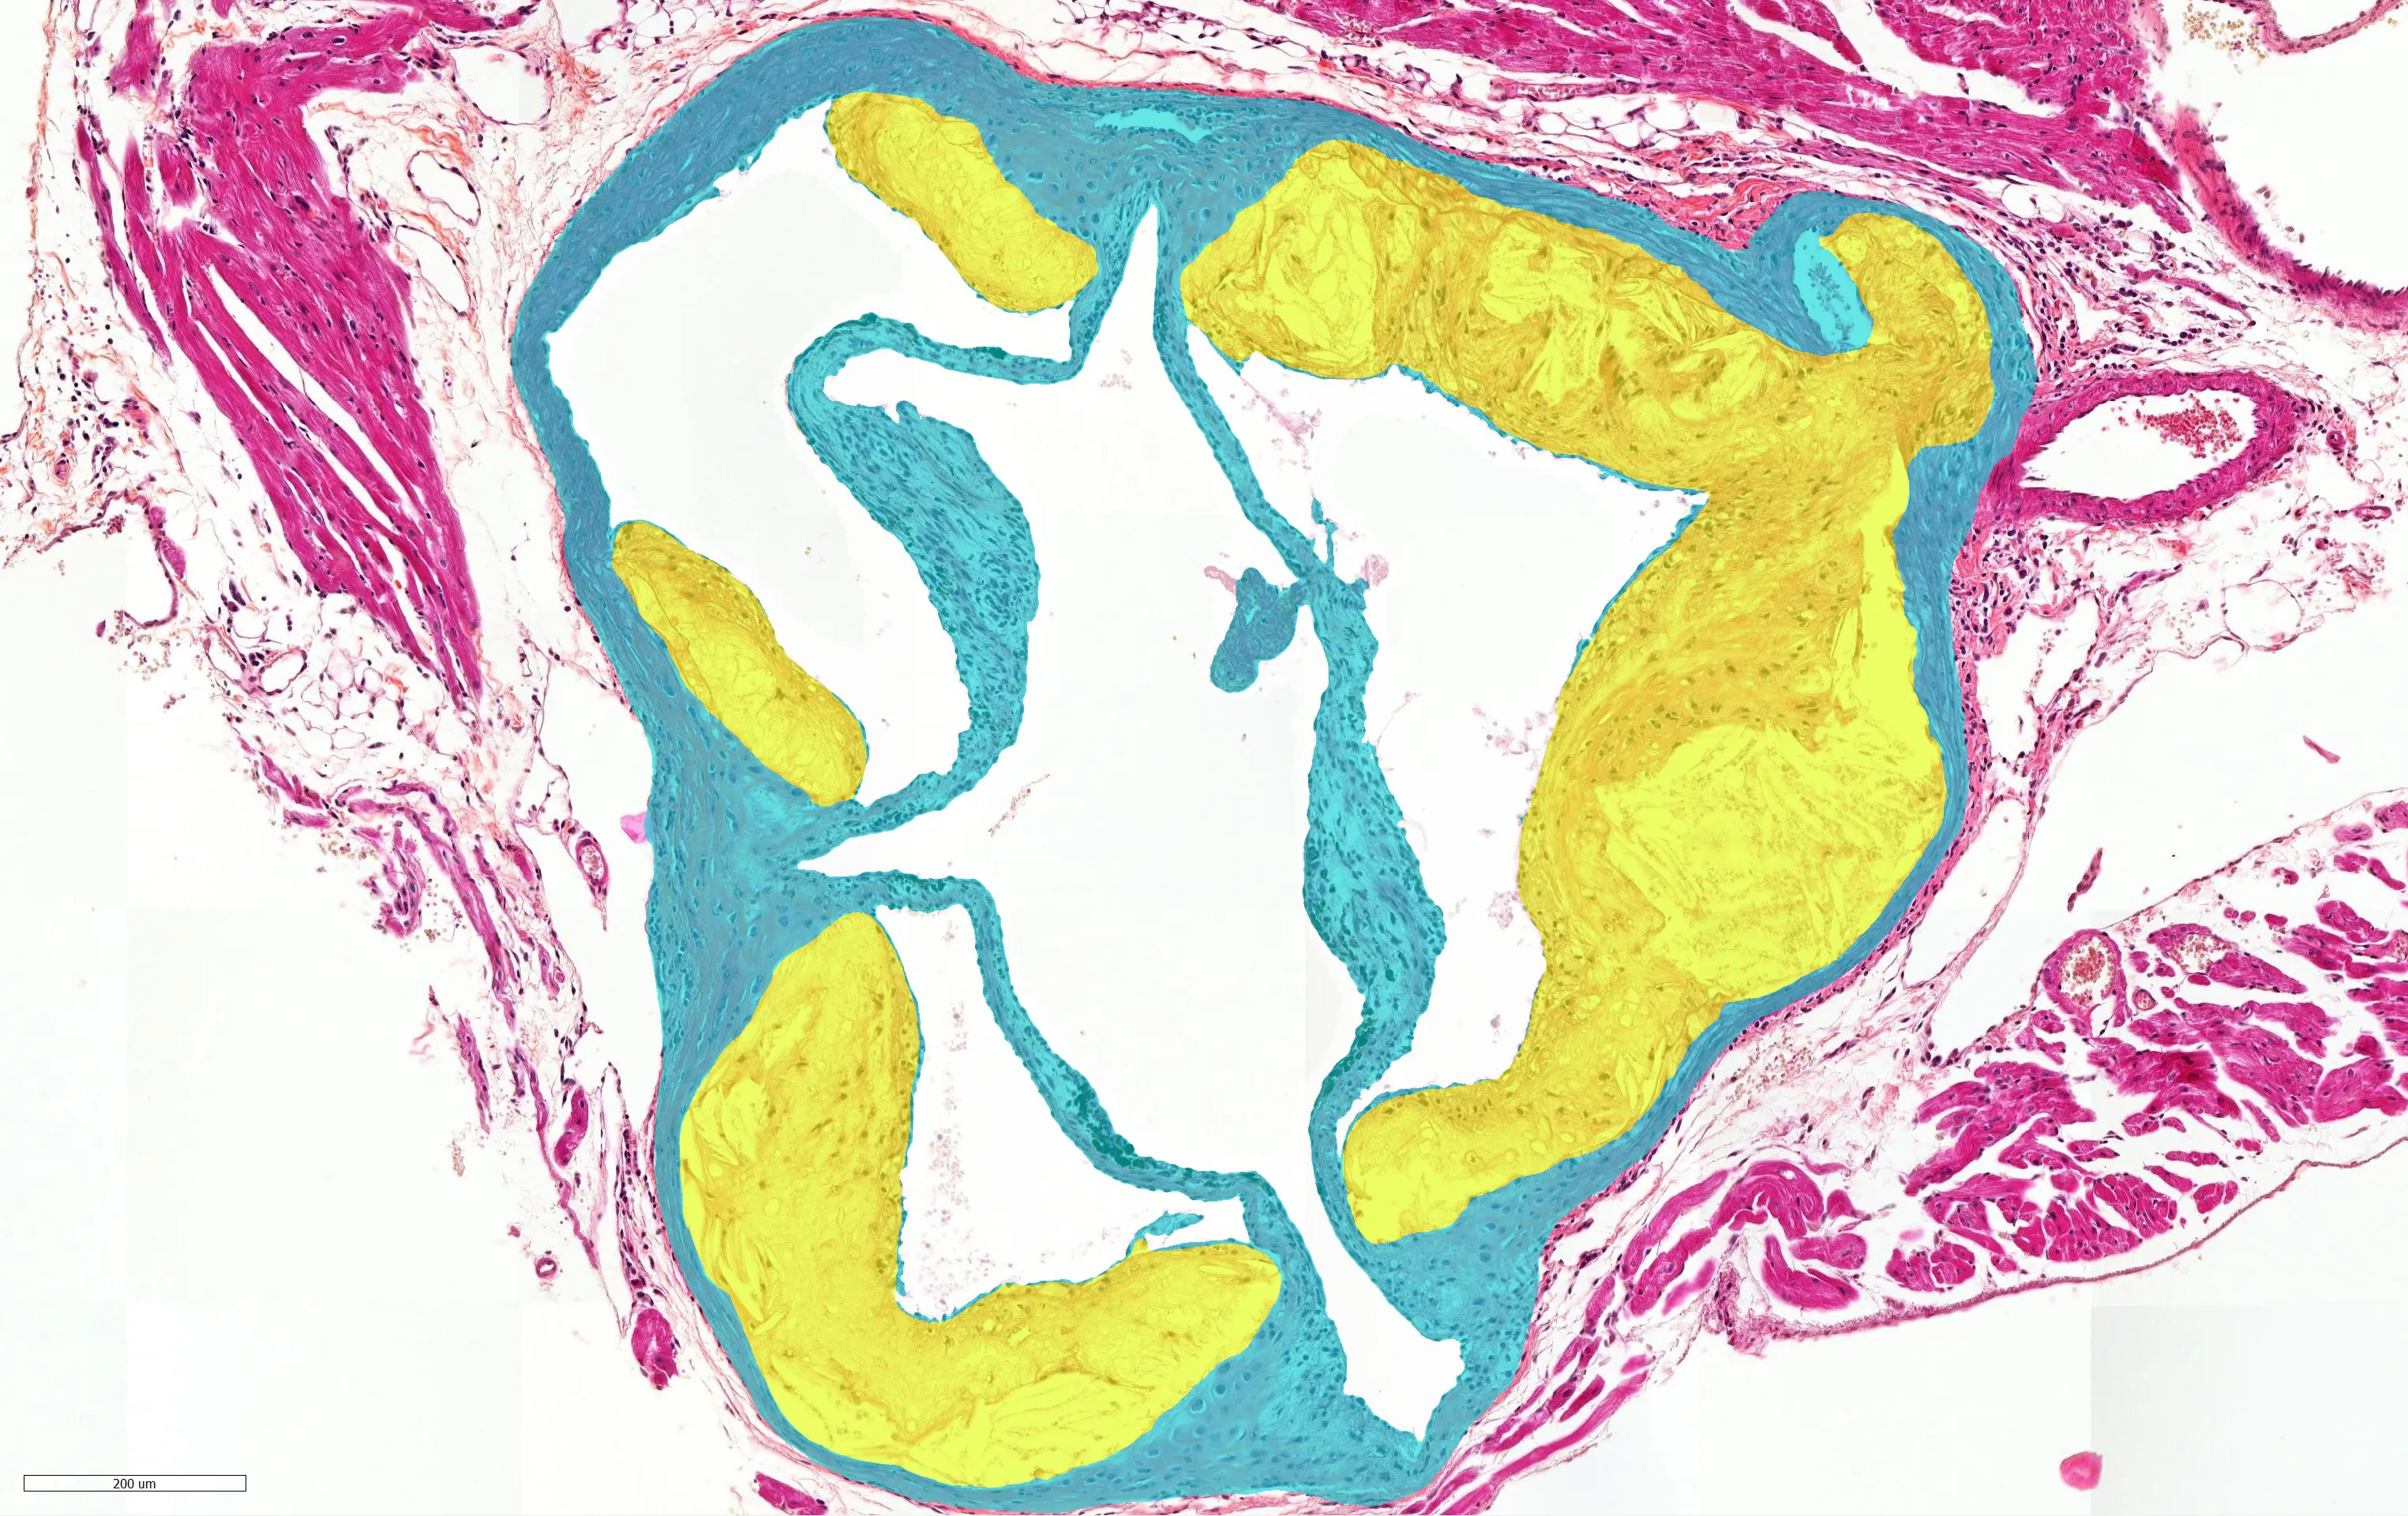 AtherosclerosisLesion area, whole cross-section
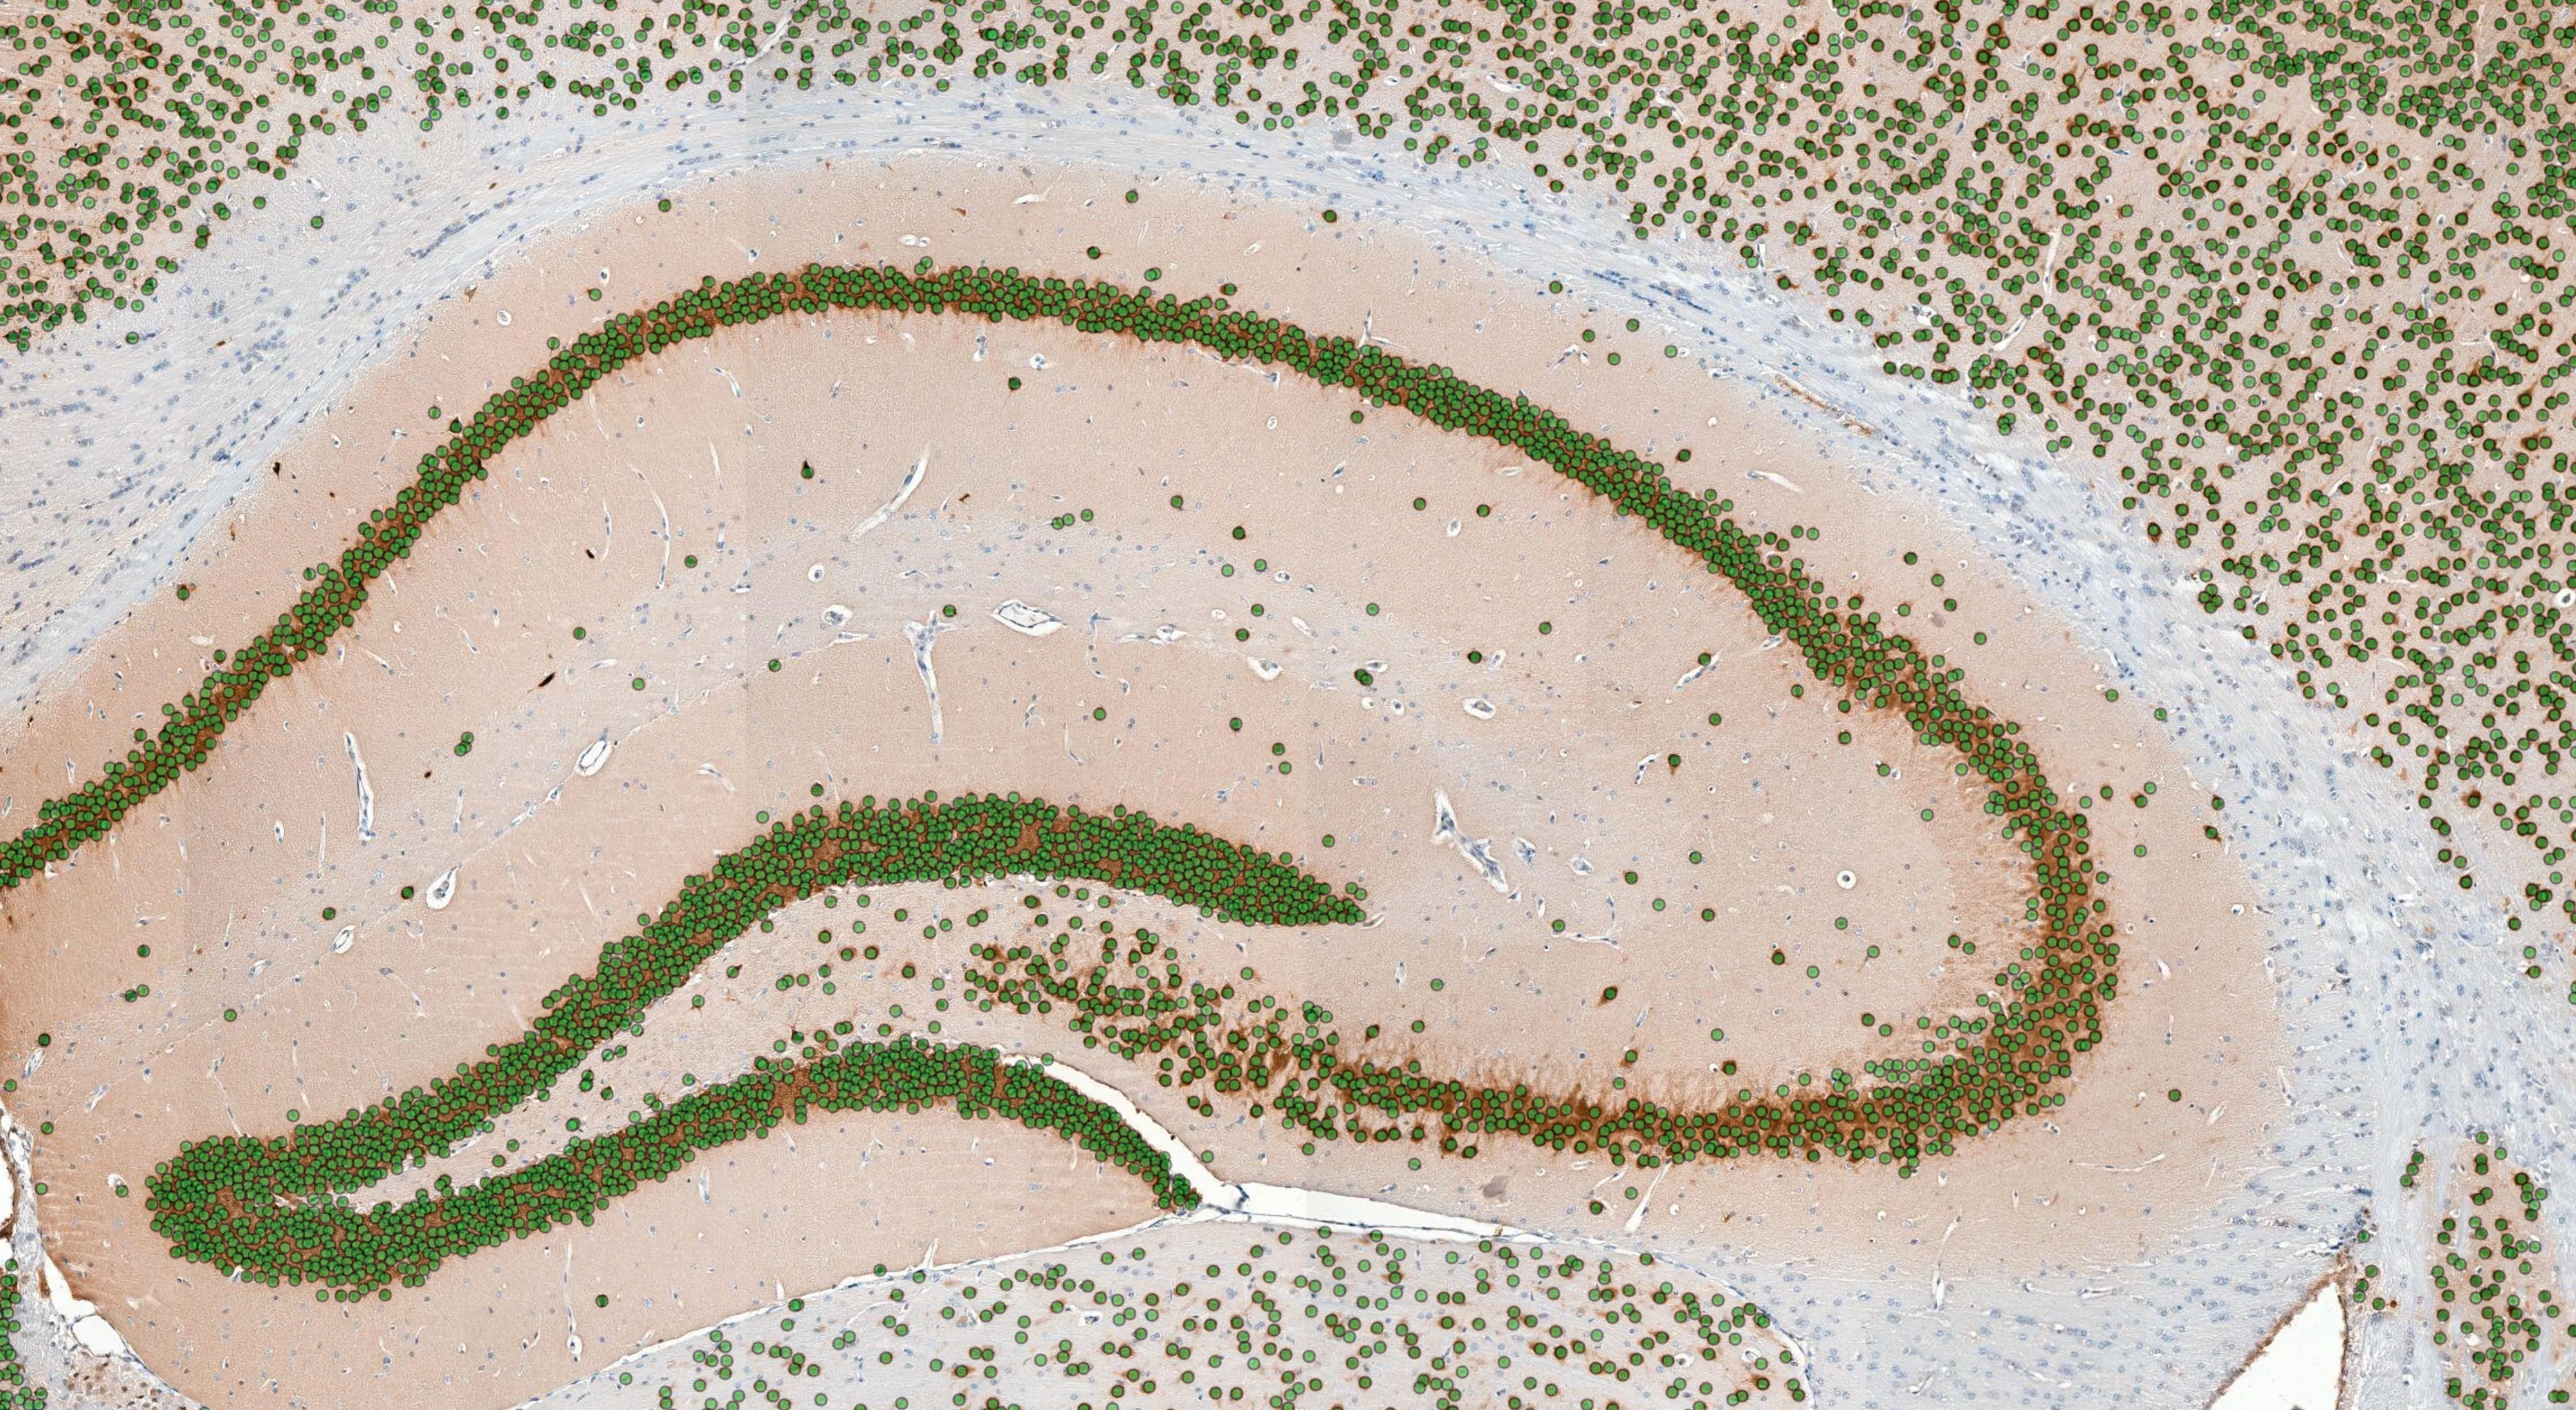 BrainNeuron density per region
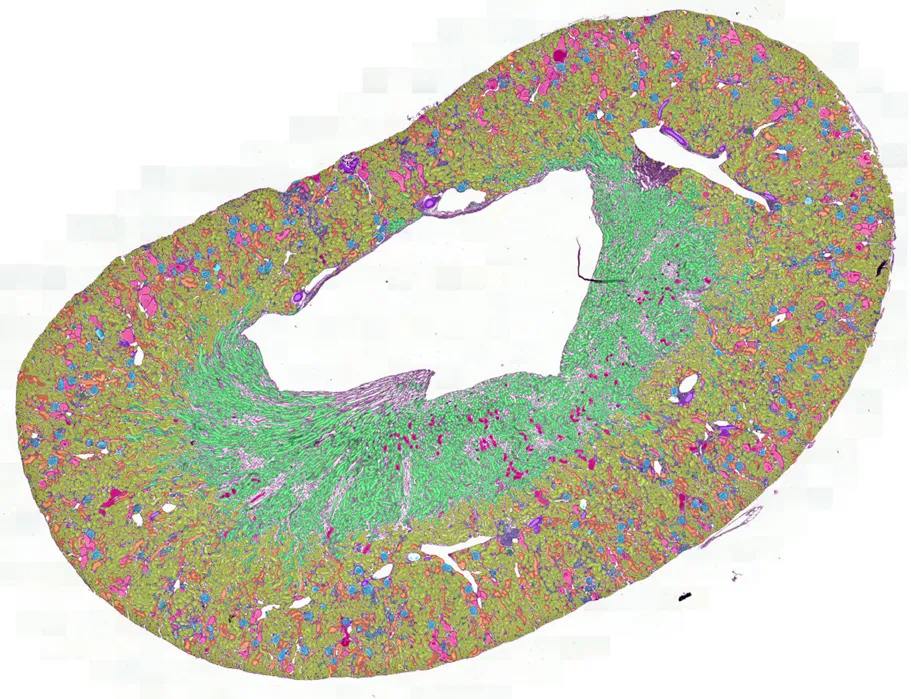 NephroPath (kidney)Every glomerulus, scored
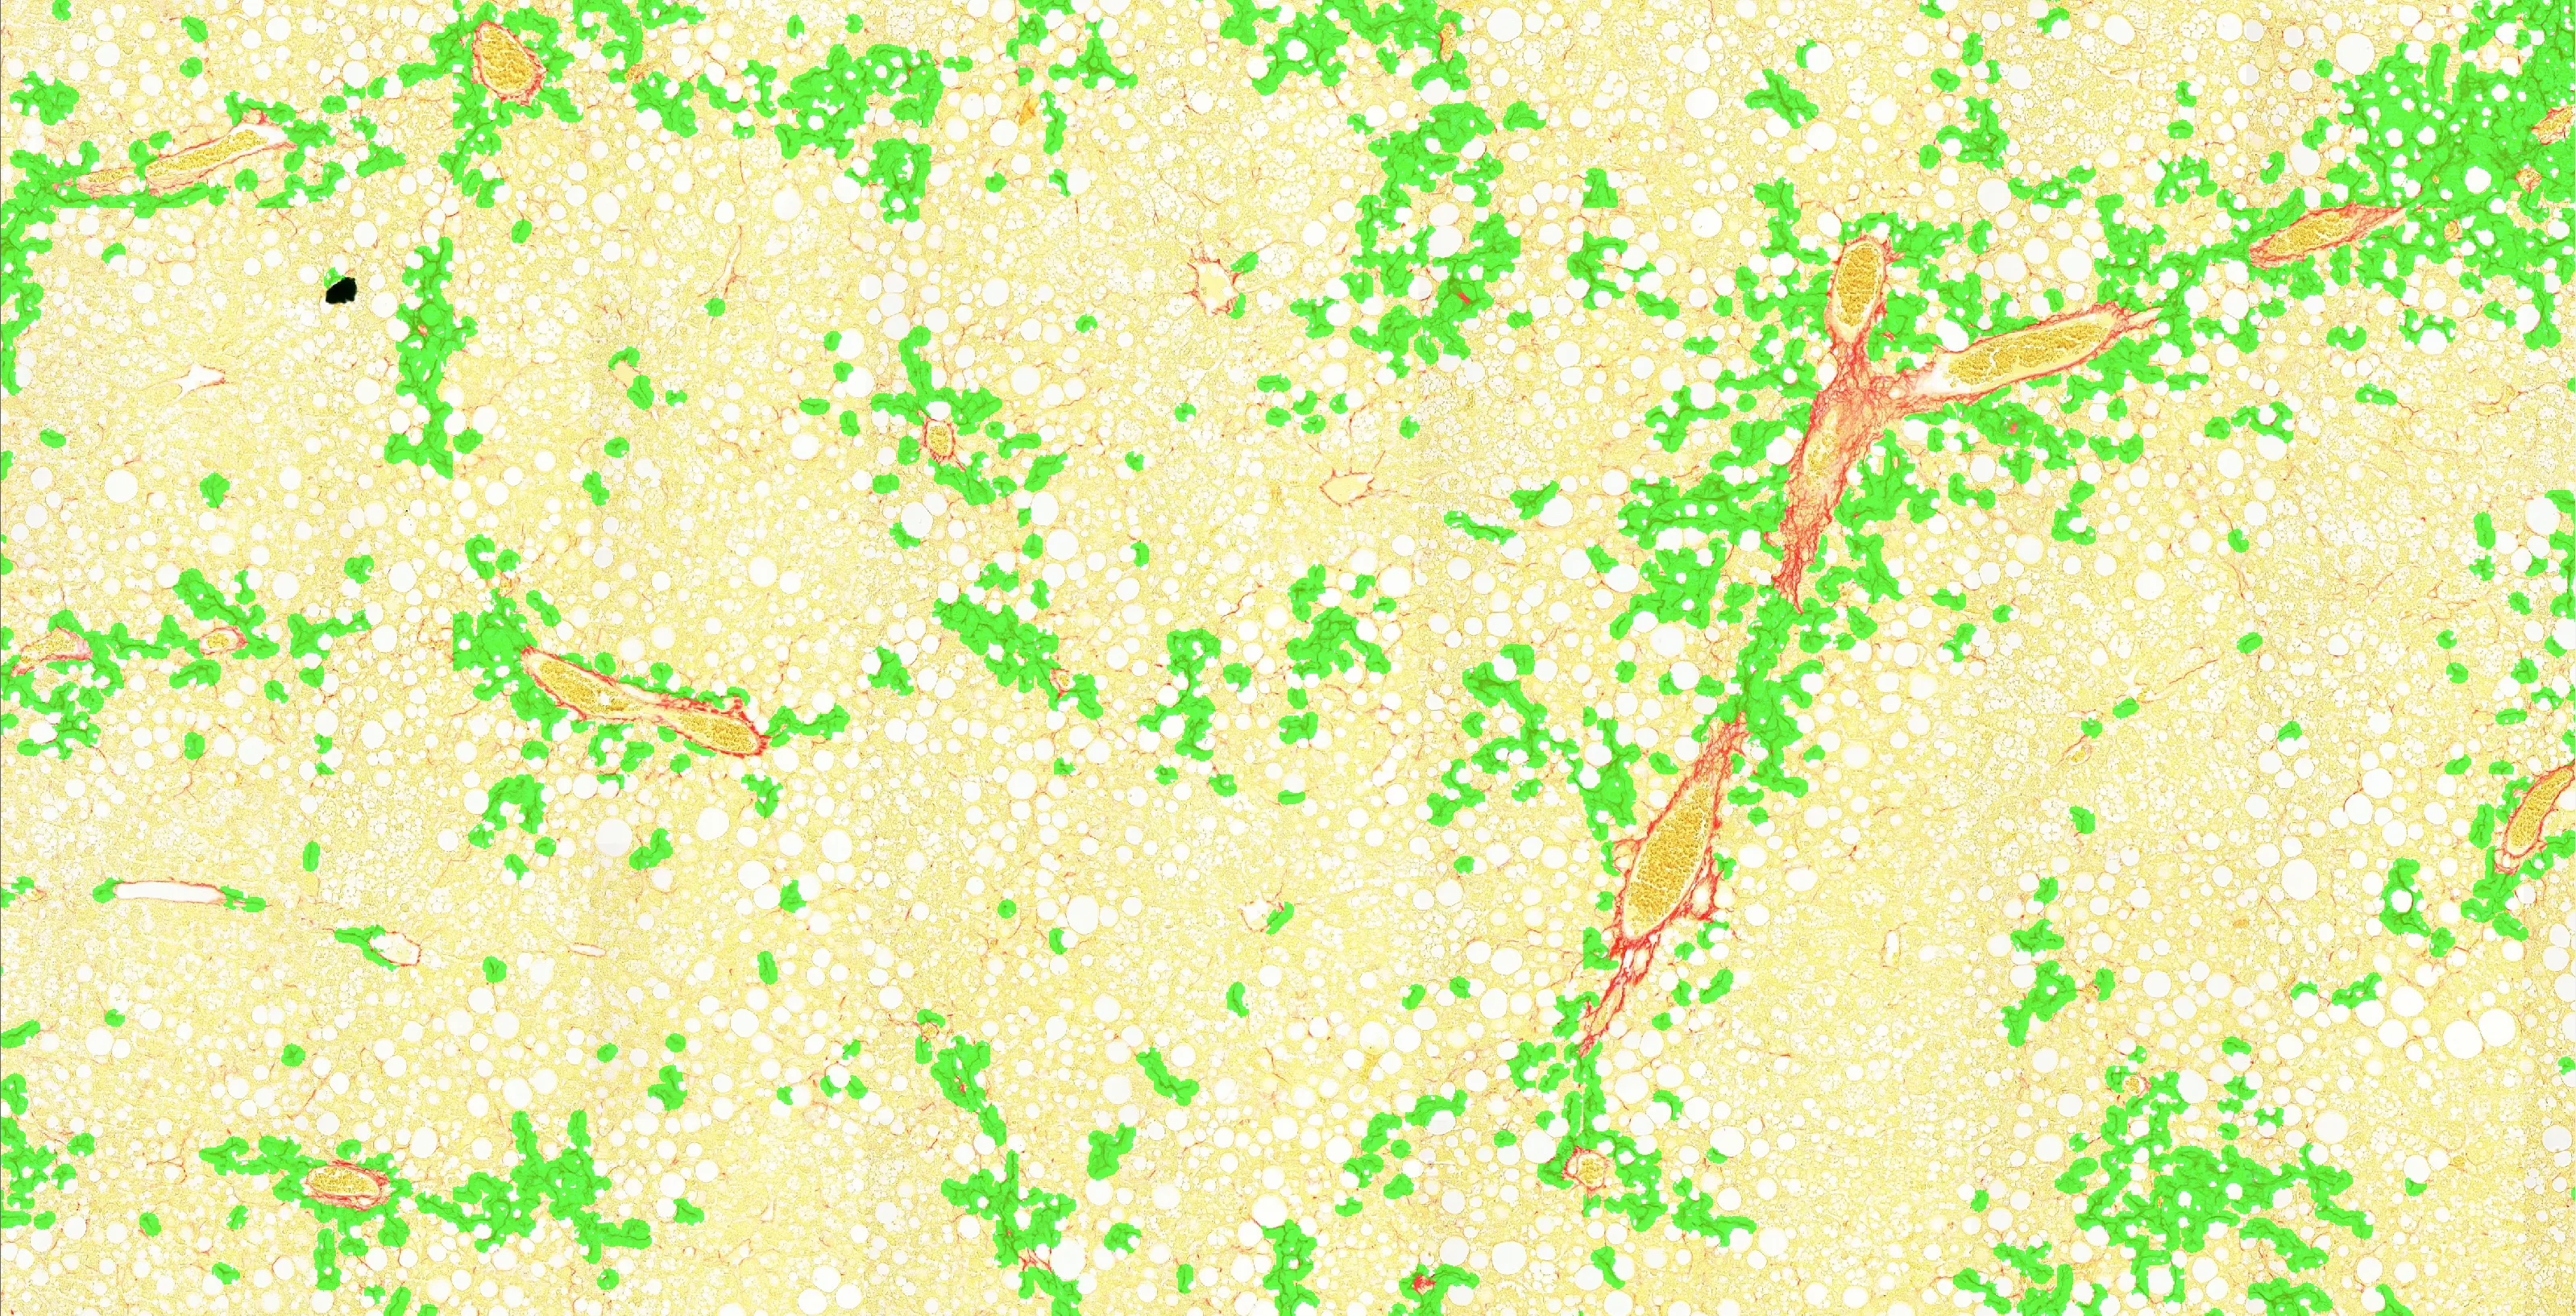 LiverFibrosis extent
Bring us a kidney cohort
Share a handful of whole-slide images and we will return the read-outs on your own tissue, so you can judge the analysis before committing a study to it.
Message sent
Thank you. We will get back to you.